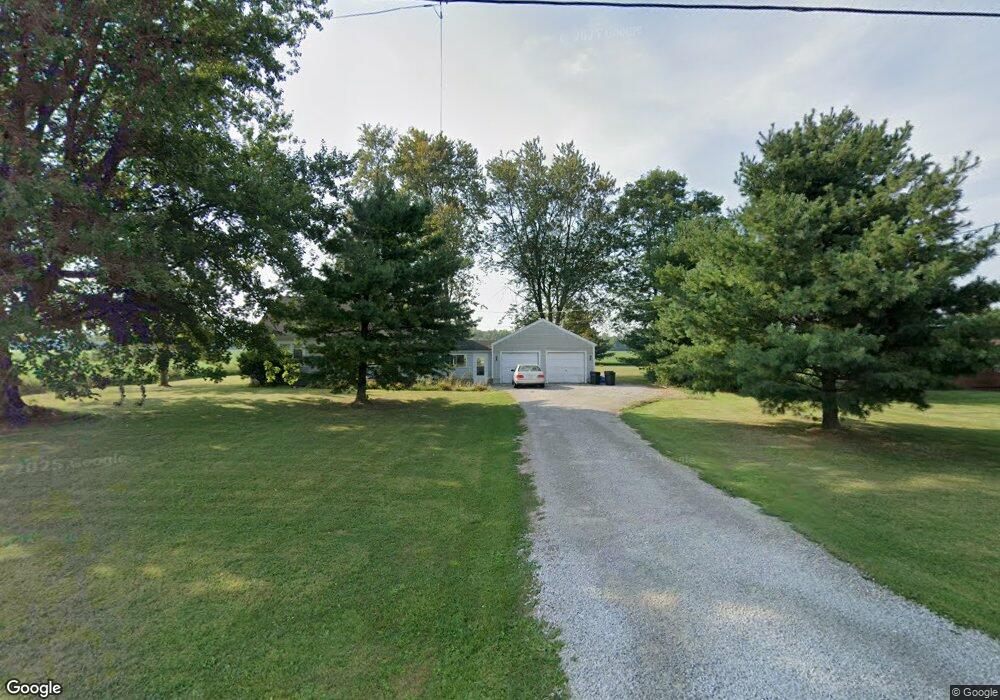
707 Somerlot Hoffman Rd W Marion, OH 43302
Estimated Value: $174,059 - $219,000
2
Beds
1
Bath
1,008
Sq Ft
$195/Sq Ft
Est. Value
About This Home
This home is located at 707 Somerlot Hoffman Rd W, Marion, OH 43302 and is currently estimated at $196,265, approximately $194 per square foot. 707 Somerlot Hoffman Rd W is a home located in Marion County with nearby schools including Pleasant Elementary School, Pleasant Middle School, and Pleasant High School.
Ownership History
Date
Name
Owned For
Owner Type
Purchase Details
Closed on
Jul 27, 2022
Sold by
Rush James E and Rush Sharon W
Bought by
Grant Kannon Edward and Grant Cindy Lynn
Current Estimated Value
Home Financials for this Owner
Home Financials are based on the most recent Mortgage that was taken out on this home.
Original Mortgage
$77,000
Outstanding Balance
$73,788
Interest Rate
5.81%
Mortgage Type
New Conventional
Estimated Equity
$122,477
Purchase Details
Closed on
Apr 8, 2011
Sold by
Rush James E and Rush Sharon W
Bought by
Grant Kannon Edward and Grant Cindy Lynn
Purchase Details
Closed on
Aug 2, 2001
Bought by
Rush James E and Surv Sharon W
Purchase Details
Closed on
Nov 1, 1995
Bought by
Rush James E and Surv Sharon W
Create a Home Valuation Report for This Property
The Home Valuation Report is an in-depth analysis detailing your home's value as well as a comparison with similar homes in the area
Home Values in the Area
Average Home Value in this Area
Purchase History
| Date | Buyer | Sale Price | Title Company |
|---|---|---|---|
| Grant Kannon Edward | -- | Hall Kevin R | |
| Grant Kannon Edward | -- | None Listed On Document | |
| Grant Kannon Edward | -- | None Available | |
| Rush James E | -- | -- | |
| Rush James E | $60,000 | -- |
Source: Public Records
Mortgage History
| Date | Status | Borrower | Loan Amount |
|---|---|---|---|
| Open | Grant Kannon Edward | $77,000 | |
| Closed | Grant Kannon Edward | $77,000 |
Source: Public Records
Tax History Compared to Growth
Tax History
| Year | Tax Paid | Tax Assessment Tax Assessment Total Assessment is a certain percentage of the fair market value that is determined by local assessors to be the total taxable value of land and additions on the property. | Land | Improvement |
|---|---|---|---|---|
| 2024 | $2,103 | $47,630 | $10,410 | $37,220 |
| 2023 | $2,103 | $47,630 | $10,410 | $37,220 |
| 2022 | $2,138 | $47,630 | $10,410 | $37,220 |
| 2021 | $1,494 | $34,570 | $8,470 | $26,100 |
| 2020 | $1,475 | $34,570 | $8,470 | $26,100 |
| 2019 | $1,546 | $34,570 | $8,470 | $26,100 |
| 2018 | $1,059 | $31,300 | $7,410 | $23,890 |
| 2017 | $1,062 | $31,300 | $7,410 | $23,890 |
| 2016 | $1,058 | $31,300 | $7,410 | $23,890 |
| 2015 | $1,073 | $30,520 | $7,060 | $23,460 |
| 2014 | $1,076 | $30,520 | $7,060 | $23,460 |
| 2012 | $1,121 | $31,600 | $6,820 | $24,780 |
Source: Public Records
Map
Nearby Homes
- 3200 Smeltzer Rd Unit 92
- 3200 Smeltzer Rd Unit 57
- 3200 Smeltzer Rd Unit 53
- 3200 Smeltzer Rd Unit 70
- 3200 Smeltzer Rd Unit 22
- 3200 Smeltzer Rd Unit 114
- 3200 Smeltzer Rd
- 2280 Smeltzer Rd
- 637 Owens Rd W
- 3306 Gooding Rd
- 2680 Marion Marysville Rd
- 343 Owens Rd W
- 3068 Marion-Waldo Rd Unit 73
- 3226 Cobblestone Creek Rd
- 0 Lighthouse Rd Unit 225029970
- 1455 Marion Country Club Dr
- 1467 Marion Country Club Dr
- 1587 Somerlot Hoffman Rd W
- 1493 Marion Country Club Dr
- 0 E Marion Cardington Rd Unit 9052845
- 721 Somerlot Hoffman Rd W
- 727 Somerlot Hoffman Rd W
- 671 Somerlot Hoffman Rd W
- 674 Somerlot Hoffman Rd W
- 742 Somerlot Hoffman Rd W
- 757 Somerlot Hoffman Rd W
- 752 Somerlot Hoffman Rd W
- 643 Somerlot Hoffman Rd W
- 662 Somerlot Hoffman Rd W
- 762 Somerlot Hoffman Rd W
- 772 Somerlot Hoffman Rd W
- 642 Somerlot Hoffman Rd W
- 627 Somerlot Hoffman Rd W
- 782 Somerlot Hoffman Rd W
- 792 Somerlot Hoffman Rd W
- 800 Somerlot Hoffman Rd W
- 802 Somerlot Hoffman Rd W
- 598 Somerlot Hoffman Rd W
- 822 Somerlot Hoffman Rd W
- 831 Somerlot Hoffman Rd W