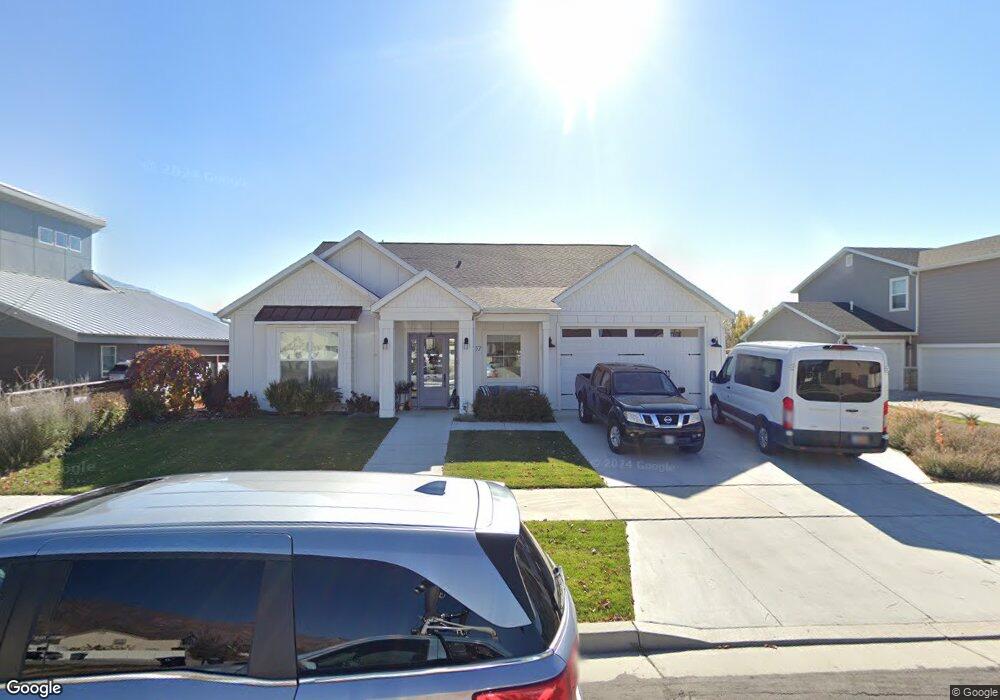
707 W 150 N Unit 17 Springville, UT 84663
Westfields North NeighborhoodEstimated Value: $566,000 - $614,000
2
Beds
3
Baths
2,410
Sq Ft
$246/Sq Ft
Est. Value
About This Home
This home is located at 707 W 150 N Unit 17, Springville, UT 84663 and is currently estimated at $593,281, approximately $246 per square foot. 707 W 150 N Unit 17 is a home located in Utah County with nearby schools including Westside Elementary School, Springville Junior High School, and Springville High School.
Ownership History
Date
Name
Owned For
Owner Type
Purchase Details
Closed on
Jun 25, 2018
Sold by
Bohrer Alan H and Bohrer Karen L
Bought by
Bohrer Alan Harry and Bohrer Karen Louise
Current Estimated Value
Home Financials for this Owner
Home Financials are based on the most recent Mortgage that was taken out on this home.
Original Mortgage
$286,400
Outstanding Balance
$250,498
Interest Rate
4.6%
Mortgage Type
Construction
Estimated Equity
$342,783
Purchase Details
Closed on
Jan 17, 2018
Sold by
R & T Investments Lc
Bought by
Bohrer Alan R and Bohrer Karen L
Purchase Details
Closed on
Apr 22, 2010
Sold by
Lre L C
Bought by
R & T Investments Lc
Purchase Details
Closed on
Jun 11, 2007
Sold by
Salisbury Development Lc
Bought by
Lre Lc
Create a Home Valuation Report for This Property
The Home Valuation Report is an in-depth analysis detailing your home's value as well as a comparison with similar homes in the area
Home Values in the Area
Average Home Value in this Area
Purchase History
| Date | Buyer | Sale Price | Title Company |
|---|---|---|---|
| Bohrer Alan Harry | -- | Old Republic Title | |
| Bohrer Alan R | -- | Inwest Title | |
| R & T Investments Lc | -- | Accommodation | |
| Lre Lc | -- | Century Title Company |
Source: Public Records
Mortgage History
| Date | Status | Borrower | Loan Amount |
|---|---|---|---|
| Open | Bohrer Alan Harry | $286,400 |
Source: Public Records
Tax History Compared to Growth
Tax History
| Year | Tax Paid | Tax Assessment Tax Assessment Total Assessment is a certain percentage of the fair market value that is determined by local assessors to be the total taxable value of land and additions on the property. | Land | Improvement |
|---|---|---|---|---|
| 2025 | $2,739 | $294,910 | $190,500 | $345,700 |
| 2024 | $2,739 | $271,865 | $0 | $0 |
| 2023 | $2,692 | $269,720 | $0 | $0 |
| 2022 | $2,909 | $286,220 | $0 | $0 |
| 2021 | $2,493 | $381,300 | $123,400 | $257,900 |
| 2020 | $59 | $349,300 | $91,400 | $257,900 |
| 2019 | $1,603 | $241,700 | $88,000 | $153,700 |
| 2018 | $1,043 | $82,500 | $82,500 | $0 |
| 2017 | $865 | $66,000 | $0 | $0 |
| 2016 | $800 | $59,800 | $0 | $0 |
| 2015 | $749 | $57,100 | $0 | $0 |
| 2014 | $665 | $50,200 | $0 | $0 |
Source: Public Records
Map
Nearby Homes
- 33 N 650 W
- 156 N 600 W
- 12 N 450 W
- 224 S 550 W Unit B-2
- 249 W 300 N
- 293 S 450 W Unit B
- 1166 W 200 S
- 1197 W 150 S
- 399 N 1325 W
- 550 S 400 W
- 650 E 3600 S
- 1456 W 350 N Unit LOT 72
- 1468 W 350 N Unit LOT 73
- 1485 W 350 N
- 470 N 75 W
- 318 W 850 N
- 147 N 100 E
- 717 S Harrison Dr Unit 29
- 749 S Harrison Dr Unit 38
- 776 S Harrison Dr Unit 78