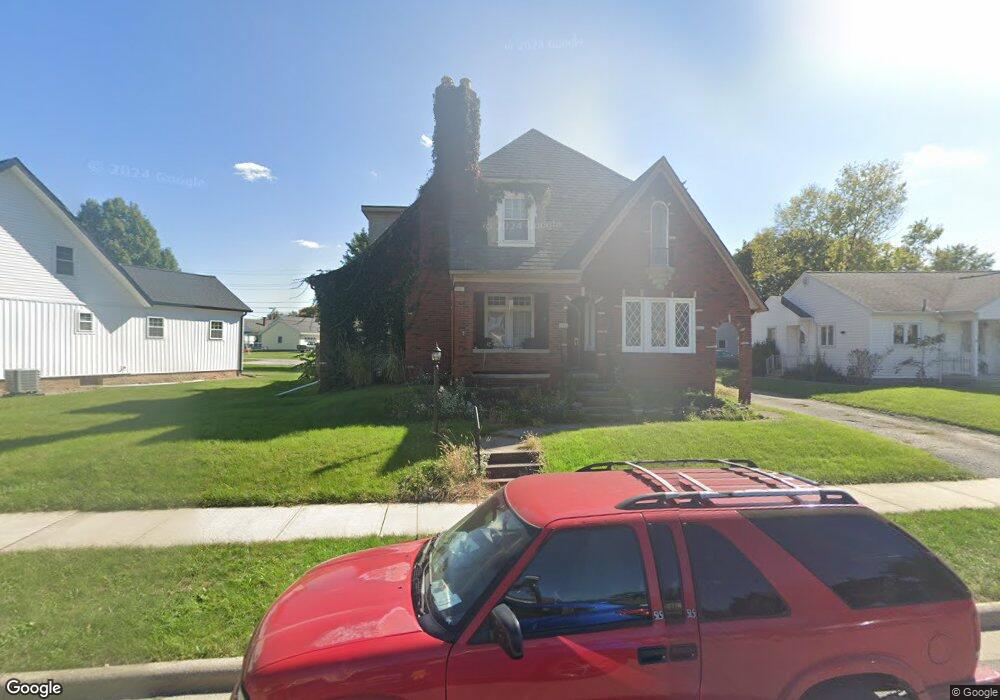
707 W Auglaize St Wapakoneta, OH 45895
Estimated Value: $250,000 - $355,000
3
Beds
2
Baths
2,300
Sq Ft
$127/Sq Ft
Est. Value
About This Home
This home is located at 707 W Auglaize St, Wapakoneta, OH 45895 and is currently estimated at $292,834, approximately $127 per square foot. 707 W Auglaize St is a home located in Auglaize County with nearby schools including Wapakoneta Elementary School, Wapakoneta High School, and Wapakoneta Middle School.
Ownership History
Date
Name
Owned For
Owner Type
Purchase Details
Closed on
Jan 23, 2008
Sold by
El Banna Sammy M and El Banna Jennifer L
Bought by
Sharp Gregg A
Current Estimated Value
Home Financials for this Owner
Home Financials are based on the most recent Mortgage that was taken out on this home.
Original Mortgage
$167,526
Interest Rate
6.36%
Mortgage Type
VA
Purchase Details
Closed on
Feb 28, 2005
Sold by
Allemeier Michael S
Bought by
El Banna Sammy M and El Banna Jennifer L
Home Financials for this Owner
Home Financials are based on the most recent Mortgage that was taken out on this home.
Original Mortgage
$140,000
Interest Rate
4.5%
Mortgage Type
Adjustable Rate Mortgage/ARM
Purchase Details
Closed on
Mar 4, 2002
Sold by
Meyer Tyra L
Bought by
Allemeier Michael S
Purchase Details
Closed on
May 20, 1998
Sold by
Fischer Daniel Lucas
Bought by
Meyer Tyra L
Create a Home Valuation Report for This Property
The Home Valuation Report is an in-depth analysis detailing your home's value as well as a comparison with similar homes in the area
Home Values in the Area
Average Home Value in this Area
Purchase History
| Date | Buyer | Sale Price | Title Company |
|---|---|---|---|
| Sharp Gregg A | $164,000 | Golden Key Title | |
| El Banna Sammy M | $43,750 | None Available | |
| Allemeier Michael S | $112,000 | -- | |
| Meyer Tyra L | $95,500 | -- |
Source: Public Records
Mortgage History
| Date | Status | Borrower | Loan Amount |
|---|---|---|---|
| Previous Owner | Sharp Gregg A | $167,526 | |
| Previous Owner | El Banna Sammy M | $140,000 |
Source: Public Records
Tax History Compared to Growth
Tax History
| Year | Tax Paid | Tax Assessment Tax Assessment Total Assessment is a certain percentage of the fair market value that is determined by local assessors to be the total taxable value of land and additions on the property. | Land | Improvement |
|---|---|---|---|---|
| 2024 | $4,153 | $85,200 | $4,520 | $80,680 |
| 2023 | $2,772 | $85,200 | $4,520 | $80,680 |
| 2022 | $2,358 | $67,350 | $5,520 | $61,830 |
| 2021 | $2,338 | $67,350 | $5,520 | $61,830 |
| 2020 | $2,345 | $67,344 | $5,516 | $61,828 |
| 2019 | $2,001 | $55,202 | $4,522 | $50,680 |
| 2018 | $2,008 | $55,202 | $4,522 | $50,680 |
| 2017 | $1,998 | $55,202 | $4,522 | $50,680 |
| 2016 | $1,731 | $47,915 | $4,305 | $43,610 |
| 2015 | $1,804 | $47,915 | $4,305 | $43,610 |
| 2014 | $1,825 | $47,915 | $4,305 | $43,610 |
| 2013 | $1,859 | $47,915 | $4,305 | $43,610 |
Source: Public Records
Map
Nearby Homes