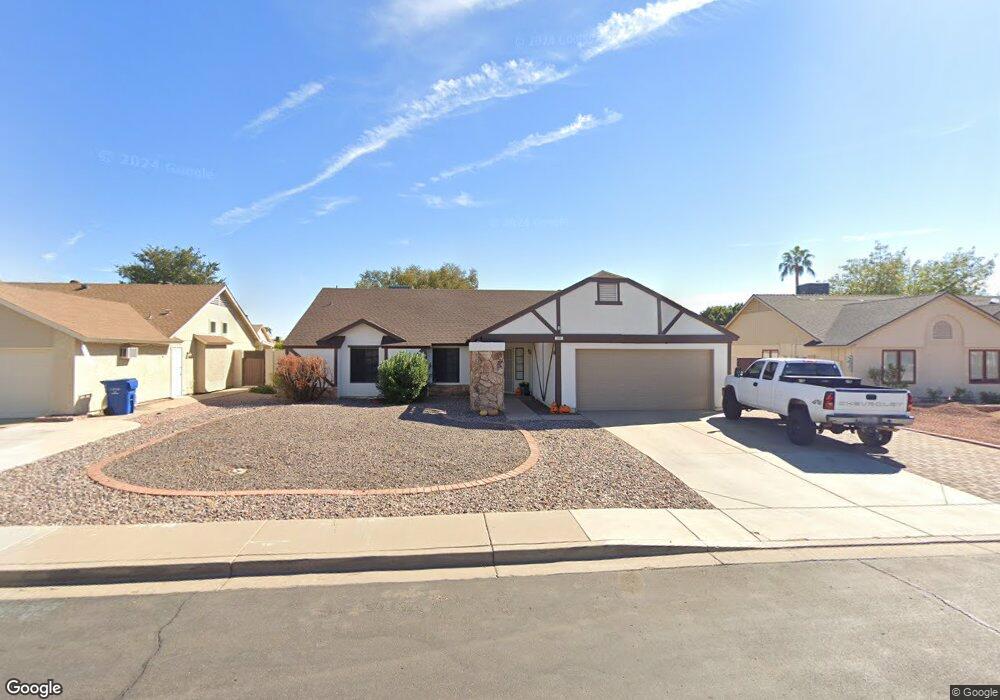
707 W Cheyenne Dr Unit 2 Chandler, AZ 85225
Amberwood NeighborhoodEstimated Value: $471,000 - $514,000
3
Beds
2
Baths
1,772
Sq Ft
$275/Sq Ft
Est. Value
About This Home
This home is located at 707 W Cheyenne Dr Unit 2, Chandler, AZ 85225 and is currently estimated at $486,993, approximately $274 per square foot. 707 W Cheyenne Dr Unit 2 is a home located in Maricopa County with nearby schools including Sirrine Elementary School, Franklin at Brimhall Elementary School, and Summit Academy Elementary.
Ownership History
Date
Name
Owned For
Owner Type
Purchase Details
Closed on
Dec 3, 2016
Sold by
Nellemann Mark and Dall Kimberley C
Bought by
Ktm 1 Llc
Current Estimated Value
Purchase Details
Closed on
Dec 7, 2010
Sold by
The Bank Of New York Mellno
Bought by
Nelleman Mark and Dall Kimberly C
Purchase Details
Closed on
Apr 30, 2010
Sold by
Fitch John K and Fitch Nina E
Bought by
The Bank Of New York Mellon and The Bank Of New York
Purchase Details
Closed on
Dec 19, 2007
Sold by
Fitch John K and Fitch Nina E
Bought by
Jnf Investments Llc
Purchase Details
Closed on
Mar 21, 2005
Sold by
Athalye Ashok G and Athalye Aruna A
Bought by
Fitch John K and Fitch Nina E
Home Financials for this Owner
Home Financials are based on the most recent Mortgage that was taken out on this home.
Original Mortgage
$152,000
Interest Rate
1.37%
Mortgage Type
Negative Amortization
Create a Home Valuation Report for This Property
The Home Valuation Report is an in-depth analysis detailing your home's value as well as a comparison with similar homes in the area
Home Values in the Area
Average Home Value in this Area
Purchase History
| Date | Buyer | Sale Price | Title Company |
|---|---|---|---|
| Ktm 1 Llc | -- | None Available | |
| Nelleman Mark | $119,001 | First American Title Ins Co | |
| The Bank Of New York Mellon | $133,200 | First American Title | |
| Jnf Investments Llc | -- | None Available | |
| Fitch John K | $190,000 | Chicago Title Insurance Co |
Source: Public Records
Mortgage History
| Date | Status | Borrower | Loan Amount |
|---|---|---|---|
| Previous Owner | Fitch John K | $152,000 | |
| Closed | Fitch John K | $19,000 |
Source: Public Records
Tax History Compared to Growth
Tax History
| Year | Tax Paid | Tax Assessment Tax Assessment Total Assessment is a certain percentage of the fair market value that is determined by local assessors to be the total taxable value of land and additions on the property. | Land | Improvement |
|---|---|---|---|---|
| 2025 | $1,911 | $18,945 | -- | -- |
| 2024 | $1,915 | $18,043 | -- | -- |
| 2023 | $1,915 | $35,550 | $7,110 | $28,440 |
| 2022 | $1,867 | $26,610 | $5,320 | $21,290 |
| 2021 | $1,856 | $24,670 | $4,930 | $19,740 |
| 2020 | $1,835 | $22,750 | $4,550 | $18,200 |
| 2019 | $1,705 | $21,150 | $4,230 | $16,920 |
| 2018 | $1,661 | $19,430 | $3,880 | $15,550 |
| 2017 | $1,601 | $18,130 | $3,620 | $14,510 |
| 2016 | $1,566 | $17,550 | $3,510 | $14,040 |
| 2015 | $1,468 | $15,680 | $3,130 | $12,550 |
Source: Public Records
Map
Nearby Homes
- 800 W Marlboro Dr
- 2712 N Evergreen St
- 916 W Loughlin Dr
- 2609 N Pleasant Dr
- 3009 N Pleasant Dr
- 305 W Nopal Place
- 617 W Chilton St
- 812 W Rosal Place
- 2940 N Oregon St Unit 9
- 2954 N Oregon St Unit 6
- 2970 N Oregon St Unit 10
- 2986 N Oregon St Unit 7
- 400 W Crofton St
- 286 W Palomino Dr Unit 147
- 286 W Palomino Dr Unit 99
- 286 W Palomino Dr Unit 75
- 286 W Palomino Dr Unit 85
- 286 W Palomino Dr Unit 83
- 307 W El Prado Rd
- 792 W El Monte Place Unit 8
- 705 W Cheyenne Dr
- 709 W Cheyenne Dr
- 706 W Loughlin Dr
- 704 W Loughlin Dr
- 711 W Cheyenne Dr
- 703 W Cheyenne Dr
- 708 W Cheyenne Dr
- 708 W Loughlin Dr
- 702 W Loughlin Dr
- 706 W Cheyenne Dr
- 710 W Cheyenne Dr
- 704 W Cheyenne Dr
- 713 W Cheyenne Dr
- 710 W Loughlin Dr
- 700 W Loughlin Dr
- 701 W Cheyenne Dr
- 712 W Cheyenne Dr
- 702 W Cheyenne Dr
- 2697 N Cheri Lynn Dr
- 709 W Marlboro Dr