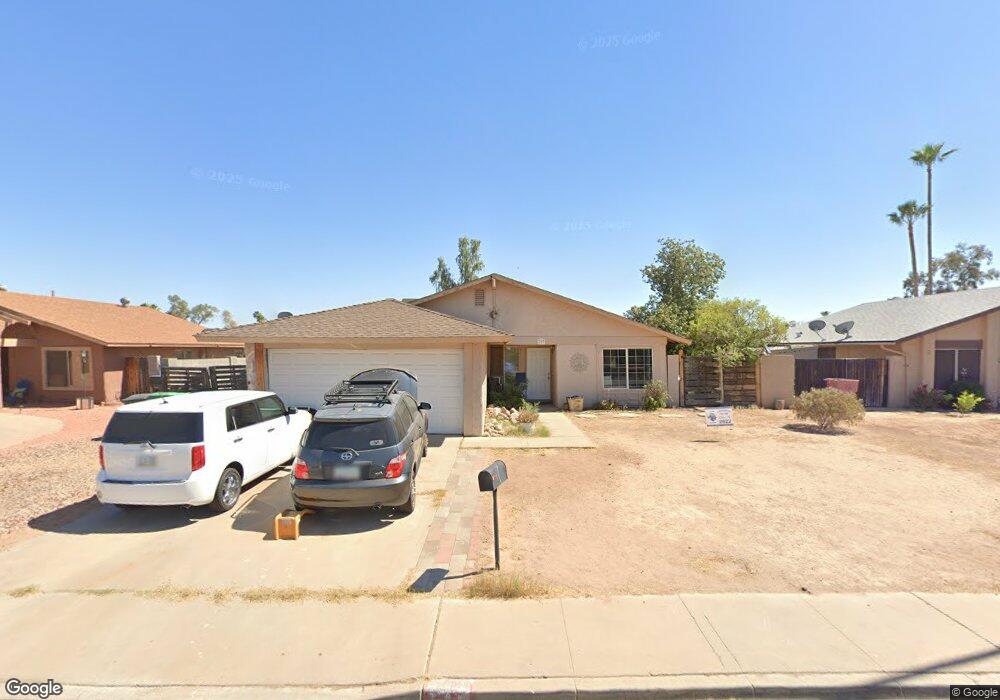
707 W Garnet Ave Mesa, AZ 85210
West Central Mesa NeighborhoodEstimated Value: $337,178 - $386,000
Studio
2
Baths
1,212
Sq Ft
$302/Sq Ft
Est. Value
About This Home
This home is located at 707 W Garnet Ave, Mesa, AZ 85210 and is currently estimated at $366,045, approximately $302 per square foot. 707 W Garnet Ave is a home located in Maricopa County with nearby schools including Redbird Elementary School, Franklin at Brimhall Elementary School, and Franklin West Elementary School.
Ownership History
Date
Name
Owned For
Owner Type
Purchase Details
Closed on
Aug 2, 2001
Sold by
Dehmler Jody Lynn
Bought by
Versteeg Marcus L
Current Estimated Value
Home Financials for this Owner
Home Financials are based on the most recent Mortgage that was taken out on this home.
Original Mortgage
$110,406
Outstanding Balance
$42,881
Interest Rate
7.09%
Mortgage Type
FHA
Estimated Equity
$323,164
Purchase Details
Closed on
Mar 21, 2000
Sold by
Hatch Lorin K and Hatch Lorin
Bought by
Versteeg Marcus L and Dehmler Jody Lynn
Home Financials for this Owner
Home Financials are based on the most recent Mortgage that was taken out on this home.
Original Mortgage
$108,691
Interest Rate
8.34%
Mortgage Type
Seller Take Back
Purchase Details
Closed on
Aug 25, 1999
Sold by
Guethle Barney S and Guethle Rebecca L
Bought by
Hatch Lorin K
Create a Home Valuation Report for This Property
The Home Valuation Report is an in-depth analysis detailing your home's value as well as a comparison with similar homes in the area
Home Values in the Area
Average Home Value in this Area
Purchase History
| Date | Buyer | Sale Price | Title Company |
|---|---|---|---|
| Versteeg Marcus L | -- | -- | |
| Versteeg Marcus L | $108,900 | Transnation Title Insurance | |
| Hatch Lorin K | $100,000 | Security Title Agency |
Source: Public Records
Mortgage History
| Date | Status | Borrower | Loan Amount |
|---|---|---|---|
| Open | Versteeg Marcus L | $110,406 | |
| Previous Owner | Versteeg Marcus L | $108,691 |
Source: Public Records
Tax History
| Year | Tax Paid | Tax Assessment Tax Assessment Total Assessment is a certain percentage of the fair market value that is determined by local assessors to be the total taxable value of land and additions on the property. | Land | Improvement |
|---|---|---|---|---|
| 2025 | $948 | $11,420 | -- | -- |
| 2024 | $959 | $10,876 | -- | -- |
| 2023 | $959 | $28,000 | $5,600 | $22,400 |
| 2022 | $938 | $21,400 | $4,280 | $17,120 |
| 2021 | $963 | $19,830 | $3,960 | $15,870 |
| 2020 | $951 | $18,000 | $3,600 | $14,400 |
| 2019 | $881 | $16,150 | $3,230 | $12,920 |
| 2018 | $841 | $13,510 | $2,700 | $10,810 |
| 2017 | $814 | $12,600 | $2,520 | $10,080 |
| 2016 | $800 | $11,810 | $2,360 | $9,450 |
| 2015 | $755 | $11,250 | $2,250 | $9,000 |
Source: Public Records
Map
Nearby Homes
- 639 W Grove Cir
- 625 W Southern Ave
- 1064 S Revere
- 461 W Holmes Ave Unit 258
- 461 W Holmes Ave Unit 350
- 461 W Holmes Ave Unit 150
- 461 W Holmes Ave Unit 383
- 808 W Isabella Ave
- 604 W Emelita Ave
- 823 W Isabella Ave
- 1056 W Farmdale Ave
- 1018 W Enid Ave
- 1367 S Country Club Dr Unit 1118
- 1367 S Country Club Dr Unit 1239
- 1367 S Country Club Dr Unit 1344
- 1367 S Country Club Dr Unit 1041
- 1367 S Country Club Dr Unit 1125
- 839 S Westwood Unit 287
- 839 S Westwood Unit 265
- 839 S Westwood Unit 184
- 713 W Garnet Ave
- 665 W Garnet Ave
- 719 W Garnet Ave
- 659 W Garnet Ave
- 664 W Grove Cir
- 714 W Grove Cir
- 704 W Garnet Ave
- 712 W Grove Cir
- 710 W Garnet Ave
- 664 W Garnet Ave
- 718 W Garnet Ave Unit CLEAN
- 718 W Garnet Ave
- 651 W Garnet Ave
- 729 W Garnet Ave
- 658 W Grove Cir
- 656 W Garnet Ave
- 716 W Grove Cir
- 650 W Garnet Ave
- 643 W Garnet Ave
- 707 W Gable Ave
Your Personal Tour Guide
Ask me questions while you tour the home.