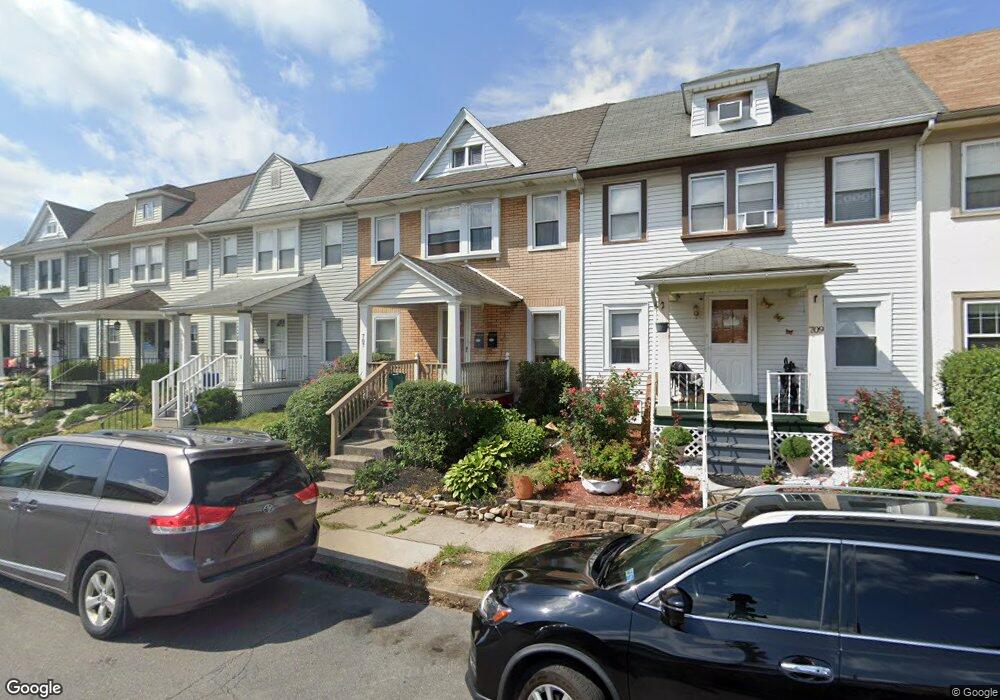
707 Wood St Bethlehem, PA 18018
Downtown Bethlehem NeighborhoodEstimated Value: $208,000 - $240,106
3
Beds
1
Bath
1,144
Sq Ft
$196/Sq Ft
Est. Value
About This Home
This home is located at 707 Wood St, Bethlehem, PA 18018 and is currently estimated at $224,527, approximately $196 per square foot. 707 Wood St is a home located in Northampton County with nearby schools including Thomas Jefferson Elementary School, Northeast Middle School, and Liberty High School.
Ownership History
Date
Name
Owned For
Owner Type
Purchase Details
Closed on
Oct 6, 2006
Sold by
Dougherty William K
Bought by
Sherman Jonathan
Current Estimated Value
Home Financials for this Owner
Home Financials are based on the most recent Mortgage that was taken out on this home.
Original Mortgage
$121,540
Outstanding Balance
$72,565
Interest Rate
6.47%
Mortgage Type
New Conventional
Estimated Equity
$151,962
Purchase Details
Closed on
Feb 1, 1991
Bought by
Dougherty Dawn L
Create a Home Valuation Report for This Property
The Home Valuation Report is an in-depth analysis detailing your home's value as well as a comparison with similar homes in the area
Home Values in the Area
Average Home Value in this Area
Purchase History
| Date | Buyer | Sale Price | Title Company |
|---|---|---|---|
| Sherman Jonathan | $121,540 | -- | |
| Dougherty Dawn L | -- | -- |
Source: Public Records
Mortgage History
| Date | Status | Borrower | Loan Amount |
|---|---|---|---|
| Open | Sherman Jonathan | $121,540 |
Source: Public Records
Tax History Compared to Growth
Tax History
| Year | Tax Paid | Tax Assessment Tax Assessment Total Assessment is a certain percentage of the fair market value that is determined by local assessors to be the total taxable value of land and additions on the property. | Land | Improvement |
|---|---|---|---|---|
| 2025 | $404 | $37,400 | $11,400 | $26,000 |
| 2024 | $3,306 | $37,400 | $11,400 | $26,000 |
| 2023 | $3,173 | $35,900 | $11,400 | $24,500 |
| 2022 | $3,148 | $35,900 | $11,400 | $24,500 |
| 2021 | $3,127 | $35,900 | $11,400 | $24,500 |
| 2020 | $3,097 | $35,900 | $11,400 | $24,500 |
| 2019 | $3,087 | $35,900 | $11,400 | $24,500 |
| 2018 | $3,012 | $35,900 | $11,400 | $24,500 |
| 2017 | $2,976 | $35,900 | $11,400 | $24,500 |
| 2016 | -- | $35,900 | $11,400 | $24,500 |
| 2015 | -- | $35,900 | $11,400 | $24,500 |
| 2014 | -- | $35,900 | $11,400 | $24,500 |
Source: Public Records
Map
Nearby Homes