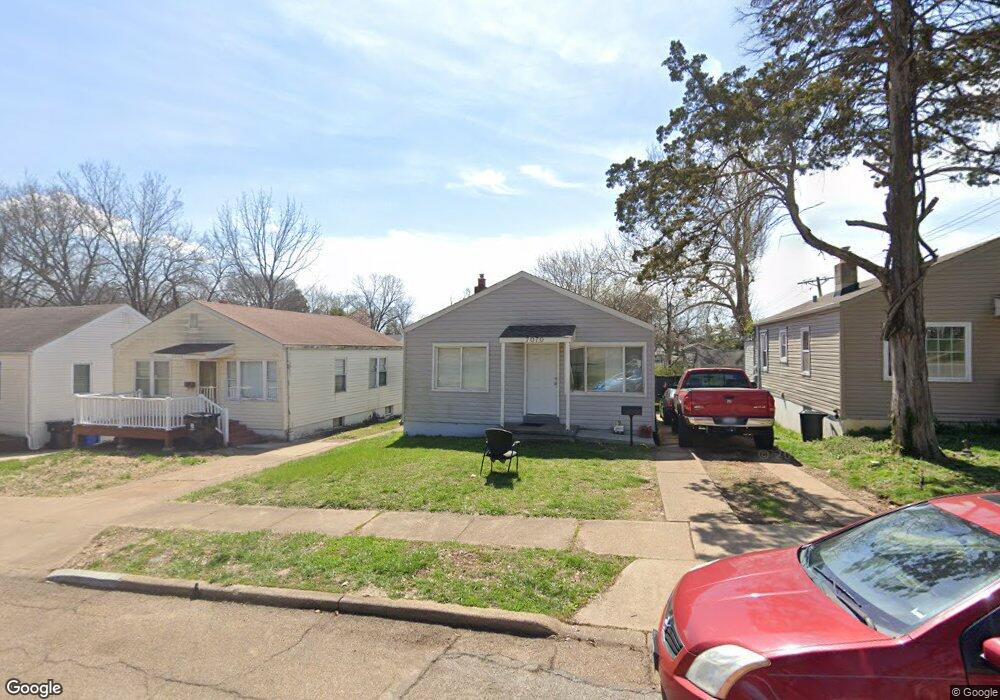
7070 Raymond Ave Saint Louis, MO 63130
Estimated Value: $117,010 - $139,000
3
Beds
1
Bath
888
Sq Ft
$149/Sq Ft
Est. Value
About This Home
This home is located at 7070 Raymond Ave, Saint Louis, MO 63130 and is currently estimated at $132,503, approximately $149 per square foot. 7070 Raymond Ave is a home located in St. Louis County with nearby schools including Pershing Elementary School, Brittany Woods Middle School, and University City High School.
Ownership History
Date
Name
Owned For
Owner Type
Purchase Details
Closed on
Jul 29, 2022
Sold by
Jade Investment Llc
Bought by
Truong John and Lam Tuyet
Current Estimated Value
Purchase Details
Closed on
Aug 28, 2019
Sold by
Williams Myra L
Bought by
Jade Investment Llc
Purchase Details
Closed on
Aug 27, 2018
Sold by
Williams Myra L
Bought by
Jade Investment Llc
Purchase Details
Closed on
Oct 10, 2008
Sold by
Williams Michael Anthony and Williams Tonya Yvette
Bought by
Williams Myra Louise
Purchase Details
Closed on
Mar 31, 2007
Sold by
Williams Myra Louise
Bought by
Williams Michael Anthony and Williams Tonya Yvette
Purchase Details
Closed on
Dec 9, 2006
Sold by
Williams Michael Anthony and Williams Tonya Yvette
Bought by
Williams Myra Louise
Purchase Details
Closed on
Oct 30, 2000
Sold by
Louise Williams Myra
Bought by
Williams Michael Anthony and Williams Tonya Yvette
Create a Home Valuation Report for This Property
The Home Valuation Report is an in-depth analysis detailing your home's value as well as a comparison with similar homes in the area
Home Values in the Area
Average Home Value in this Area
Purchase History
| Date | Buyer | Sale Price | Title Company |
|---|---|---|---|
| Truong John | -- | Investors Title | |
| Jade Investment Llc | $6,500 | None Available | |
| Jade Investment Llc | $6,500 | None Available | |
| Williams Myra Louise | -- | None Available | |
| Williams Michael Anthony | -- | None Available | |
| Williams Myra Louise | -- | None Available | |
| Williams Michael Anthony | -- | -- |
Source: Public Records
Tax History Compared to Growth
Tax History
| Year | Tax Paid | Tax Assessment Tax Assessment Total Assessment is a certain percentage of the fair market value that is determined by local assessors to be the total taxable value of land and additions on the property. | Land | Improvement |
|---|---|---|---|---|
| 2025 | $1,249 | $19,400 | $6,590 | $12,810 |
| 2024 | $1,249 | $17,020 | $2,260 | $14,760 |
| 2023 | $1,247 | $17,020 | $2,260 | $14,760 |
| 2022 | $1,219 | $15,480 | $2,260 | $13,220 |
| 2021 | $1,206 | $15,480 | $2,260 | $13,220 |
| 2020 | $1,026 | $12,730 | $5,640 | $7,090 |
| 2019 | $1,017 | $12,730 | $5,640 | $7,090 |
| 2018 | $1,095 | $12,730 | $3,380 | $9,350 |
| 2017 | $1,097 | $12,730 | $3,380 | $9,350 |
| 2016 | $1,035 | $11,460 | $3,760 | $7,700 |
| 2015 | $1,039 | $11,460 | $3,760 | $7,700 |
| 2014 | -- | $10,680 | $2,300 | $8,380 |
Source: Public Records
Map
Nearby Homes
- 7048 Raymond Ave
- 7012 Melrose Ave
- 7055 Plymouth Ave
- 7039 Plymouth Ave
- 1118 George St
- 6954 Plymouth Ave
- 6934 Julian Ave
- 7032 Canton Ave
- 6922 Plymouth Ave
- 1209 Griefield Place
- 7171 White Oak Ln
- 6937 Etzel Ave
- 1251 Waldron Ave
- 1085 Pennsylvania Ave
- 1529 Nixon Ave
- 1207 Buckner Place
- 1520 Purdue Ave
- 6821 Raymond Ave
- 7315 Ahern Ave
- 6835 Etzel Ave
- 7074 Raymond Ave
- 7068 Raymond Ave
- 7064 Raymond Ave
- 7075 Melrose Ave
- 7060 Raymond Ave
- 7077 Melrose Ave
- 7071 Melrose Ave
- 7069 Melrose Ave
- 1227 Partridge Ave
- 1223 Partridge Ave
- 7056 Raymond Ave
- 1219 Partridge Ave
- 1235 Partridge Ave
- 7061 Melrose Ave
- 7052 Raymond Ave
- 1209 Partridge Ave
- 7053 Melrose Ave
- 1245 Partridge Ave
- 1226 Watts Ave
- 1222 Watts Ave