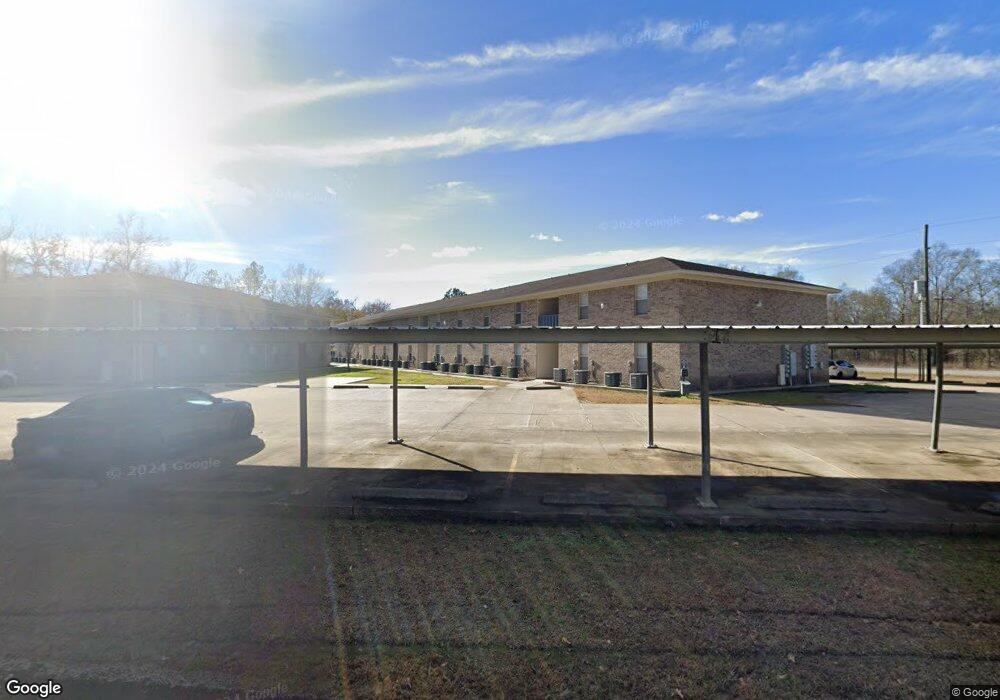
7071 S Bilbo Rd Unit 29 Orange, TX 77632
East Orange NeighborhoodEstimated Value: $1,341,663
1
Bed
--
Bath
518
Sq Ft
$2,590/Sq Ft
Est. Value
About This Home
This home is located at 7071 S Bilbo Rd Unit 29, Orange, TX 77632 and is currently priced at $1,341,663, approximately $2,590 per square foot. 7071 S Bilbo Rd Unit 29 is a home located in Orange County with nearby schools including Mauriceville Elementary School, Mauriceville Middle School, and Lit Cypr-Mrceville High School.
Ownership History
Date
Name
Owned For
Owner Type
Purchase Details
Closed on
Feb 19, 2019
Sold by
Gta Investments Ltd
Bought by
Provincial Interests Llc
Current Estimated Value
Home Financials for this Owner
Home Financials are based on the most recent Mortgage that was taken out on this home.
Original Mortgage
$956,250
Outstanding Balance
$839,001
Interest Rate
4.4%
Mortgage Type
Commercial
Purchase Details
Closed on
Sep 22, 2015
Sold by
Thomas Peter Richard and Thomas Pamela Truitt
Bought by
Ferguson William T
Home Financials for this Owner
Home Financials are based on the most recent Mortgage that was taken out on this home.
Original Mortgage
$15,000
Interest Rate
3.99%
Mortgage Type
Purchase Money Mortgage
Purchase Details
Closed on
Jun 9, 2000
Sold by
Unknown Seller
Bought by
Watkins Watkins W and Watkins H
Purchase Details
Closed on
Aug 23, 1989
Sold by
Unknown Seller
Bought by
Watkins Watkins W and Watkins H
Create a Home Valuation Report for This Property
The Home Valuation Report is an in-depth analysis detailing your home's value as well as a comparison with similar homes in the area
Home Values in the Area
Average Home Value in this Area
Purchase History
| Date | Buyer | Sale Price | Title Company |
|---|---|---|---|
| Provincial Interests Llc | -- | Texas Regional Title | |
| Gta Investments Ltd | -- | Texas Regional Title | |
| Ferguson William T | -- | Security Abstract & Title | |
| Watkins Watkins W | -- | -- | |
| Watkins Watkins W | -- | -- |
Source: Public Records
Mortgage History
| Date | Status | Borrower | Loan Amount |
|---|---|---|---|
| Open | Provincial Interests Llc | $956,250 | |
| Previous Owner | Ferguson William T | $15,000 |
Source: Public Records
Tax History Compared to Growth
Tax History
| Year | Tax Paid | Tax Assessment Tax Assessment Total Assessment is a certain percentage of the fair market value that is determined by local assessors to be the total taxable value of land and additions on the property. | Land | Improvement |
|---|---|---|---|---|
| 2024 | $17,104 | $945,820 | $9,888 | $935,932 |
| 2023 | $15,112 | $839,863 | $9,888 | $829,975 |
| 2022 | $24,697 | $1,208,434 | $9,888 | $1,198,546 |
| 2021 | $30,560 | $1,487,835 | $9,888 | $1,477,947 |
| 2020 | $31,576 | $1,525,754 | $9,888 | $1,515,866 |
| 2019 | $21,156 | $919,414 | $9,888 | $909,526 |
| 2018 | $20,020 | $930,917 | $9,888 | $921,029 |
| 2017 | $19,621 | $925,814 | $9,888 | $915,926 |
| 2016 | $21,502 | $998,800 | $9,888 | $988,912 |
| 2015 | $26,280 | $1,250,625 | $9,888 | $1,240,737 |
| 2014 | $26,280 | $1,251,977 | $9,888 | $1,242,089 |
Source: Public Records
Map
Nearby Homes
- 13950 Texas 12
- 6722 Royal Oaks Cir
- 7158 Royal Oaks Cir
- 5771 Amrock Rd
- TBD Amrock Rd Unit Can be Divided
- 1.24 ac Circle 5 St
- 7526 Circle 10
- 000 Fm 1130
- 7490 Circle 4
- 7745 Wayne Rd
- 000 Texas 12
- 13355 Texas 12
- 13045 Texas 12
- 12765 Texas 12
- Hwy 12 Texas 12
- 7640 Sandra Ln
- 000 Betsy Ln
- 0000 Circle 1 St
- 5856 Sharlane Dr
- 7773 Betsy Ln
- 7071 S Bilbo Rd Unit 19
- 7071 S Bilbo Rd Unit 8
- 7071 S Bilbo Rd Unit 4
- 7071 S Bilbo Rd Unit 20
- 7071 S Bilbo Rd Unit 27
- 7071 S Bilbo Rd Unit 28
- 7071 S Bilbo Rd Unit 26
- 7071 S Bilbo Rd Unit 11
- 7071 S Bilbo Rd Unit 9
- 7071 S Bilbo Rd Unit 12
- 7071 S Bilbo Rd Unit 18
- 6996 S Bilbo Rd
- 13674 Highway 12
- 6918 S Bilbo Rd
- 13955 Highway 12
- 13955 Highway 12
- 6919 S Bilbo Rd
- 13558 Highway 12
- 6907 Morris Rd
- 14036 Highway 12