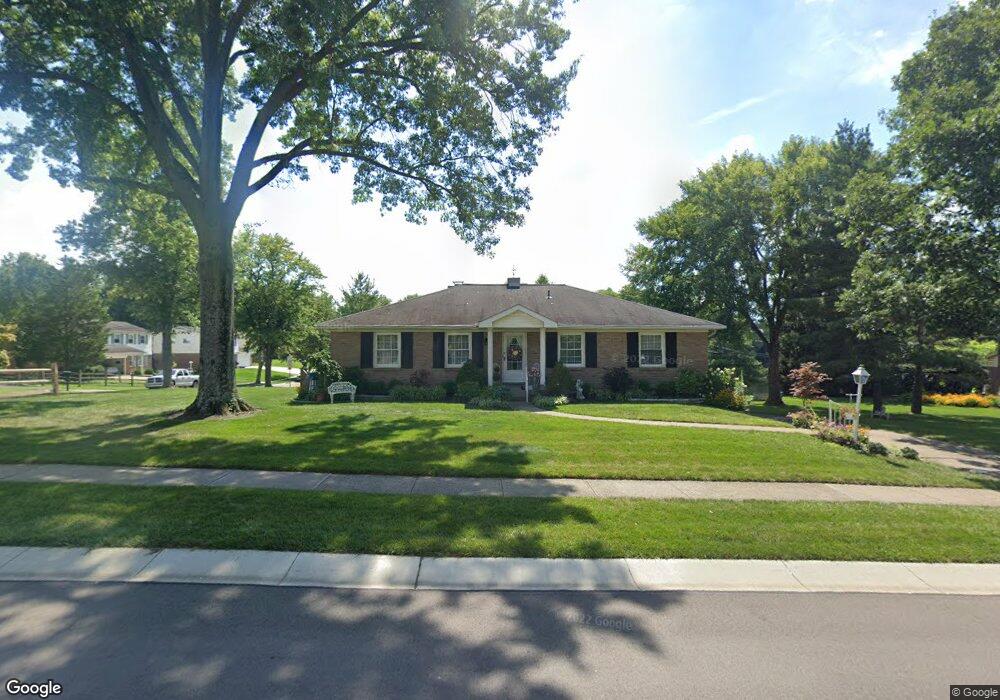
7075 Pickway Dr Cincinnati, OH 45233
Estimated Value: $325,291 - $374,000
3
Beds
2
Baths
1,584
Sq Ft
$221/Sq Ft
Est. Value
About This Home
This home is located at 7075 Pickway Dr, Cincinnati, OH 45233 and is currently estimated at $350,573, approximately $221 per square foot. 7075 Pickway Dr is a home located in Hamilton County with nearby schools including John Foster Dulles Elementary School, Rapid Run Middle School, and Oak Hills High School.
Ownership History
Date
Name
Owned For
Owner Type
Purchase Details
Closed on
Apr 1, 2016
Sold by
William K Dorton
Bought by
Darwish John and Darwish Lura
Current Estimated Value
Home Financials for this Owner
Home Financials are based on the most recent Mortgage that was taken out on this home.
Original Mortgage
$85,000
Outstanding Balance
$66,859
Interest Rate
3.71%
Estimated Equity
$283,714
Purchase Details
Closed on
Mar 31, 2016
Sold by
Dorton William K
Bought by
Darwish John M and Darwish Lura I
Home Financials for this Owner
Home Financials are based on the most recent Mortgage that was taken out on this home.
Original Mortgage
$85,000
Outstanding Balance
$66,859
Interest Rate
3.71%
Estimated Equity
$283,714
Purchase Details
Closed on
Jan 18, 2008
Sold by
Estate Of Agnes D Dorton
Bought by
Dorton William K
Create a Home Valuation Report for This Property
The Home Valuation Report is an in-depth analysis detailing your home's value as well as a comparison with similar homes in the area
Home Values in the Area
Average Home Value in this Area
Purchase History
| Date | Buyer | Sale Price | Title Company |
|---|---|---|---|
| Darwish John | -- | -- | |
| Darwish John M | $165,000 | -- | |
| Dorton William K | -- | Attorney |
Source: Public Records
Mortgage History
| Date | Status | Borrower | Loan Amount |
|---|---|---|---|
| Open | Darwish John M | $85,000 | |
| Closed | Darwish John M | -- | |
| Closed | Darwish John M | -- |
Source: Public Records
Tax History
| Year | Tax Paid | Tax Assessment Tax Assessment Total Assessment is a certain percentage of the fair market value that is determined by local assessors to be the total taxable value of land and additions on the property. | Land | Improvement |
|---|---|---|---|---|
| 2025 | $4,146 | $89,789 | $17,297 | $72,492 |
| 2023 | $4,093 | $89,789 | $17,297 | $72,492 |
| 2022 | $3,006 | $58,905 | $14,686 | $44,219 |
| 2021 | $2,690 | $58,905 | $14,686 | $44,219 |
| 2020 | $2,737 | $58,905 | $14,686 | $44,219 |
| 2019 | $2,927 | $57,750 | $14,399 | $43,351 |
| 2018 | $2,931 | $57,750 | $14,399 | $43,351 |
| 2017 | $2,757 | $57,750 | $14,399 | $43,351 |
| 2016 | $2,807 | $58,678 | $13,923 | $44,755 |
| 2015 | $2,838 | $58,678 | $13,923 | $44,755 |
| 2014 | $2,843 | $58,678 | $13,923 | $44,755 |
| 2013 | $2,688 | $59,269 | $14,063 | $45,206 |
Source: Public Records
Map
Nearby Homes
- 6944 Old Stone Ridge
- 7105 Willowdale Dr
- 2735 Buckridge Dr
- 3388 Markdale Ct
- 2759 Buckridge Dr
- 2417 Quail Run Farm Ln
- 2659 Devils Backbone Rd
- 1681 van Blaricum Rd
- 2239 Quail Run Farm Ln
- Lot 28 Southpointe Dr
- 2794 Buckridge Dr
- 2850 Buckridge Dr
- 3037 Barnbougle Dr
- 7332 Hillside Ave
- 3049 Barnbougle Dr
- 7516 Donegal Dr
- 7511 Donegal Dr
- 7716 Carnoustie Ct
- 6684 Powner Farm Dr
- 2 Quarry Rd
- 7032 Wyandotte Dr
- 7085 Pickway Dr
- 7091 Pickway Dr
- 7040 Wyandotte Dr
- 7080 Pickway Dr
- 7072 Pickway Dr
- 7055 Pickway Dr
- 7064 Pickway Dr
- 7031 Wyandotte Dr
- 7088 Pickway Dr
- 7058 Pickway Dr
- 7099 Pickway Dr
- 7046 Wyandotte Dr
- 7039 Wyandotte Dr
- 7039 Pickway Dr
- 7050 Pickway Dr
- 7096 Pickway Dr
- 7045 Wyandotte Dr
- 7107 Pickway Dr
- 7054 Wyandotte Dr
Your Personal Tour Guide
Ask me questions while you tour the home.