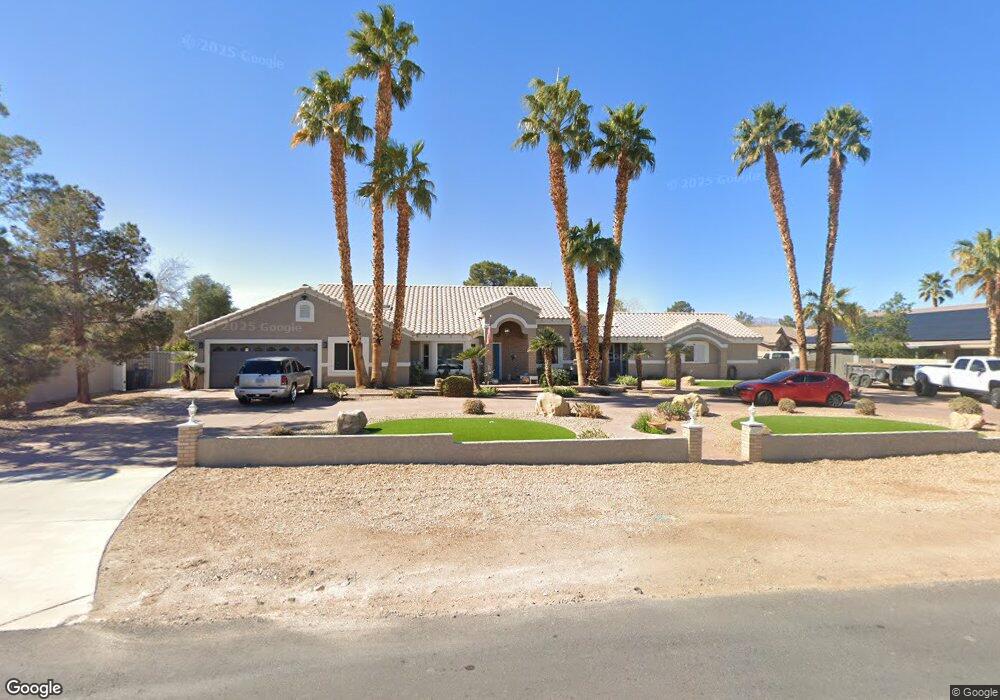
7075 Schirlls St Las Vegas, NV 89118
Coronado Ranch NeighborhoodEstimated Value: $880,439 - $1,162,000
5
Beds
5
Baths
3,760
Sq Ft
$276/Sq Ft
Est. Value
About This Home
This home is located at 7075 Schirlls St, Las Vegas, NV 89118 and is currently estimated at $1,039,110, approximately $276 per square foot. 7075 Schirlls St is a home located in Clark County with nearby schools including Dr. Beverly S. Mathis Elementary School, Lawrence & Heidi Canarelli Middle School, and Desert Oasis High School.
Ownership History
Date
Name
Owned For
Owner Type
Purchase Details
Closed on
Nov 12, 2009
Sold by
Cass Ben T and Cass Sharon K
Bought by
Schagh Terry S and Schagh Daedre C
Current Estimated Value
Home Financials for this Owner
Home Financials are based on the most recent Mortgage that was taken out on this home.
Original Mortgage
$407,000
Outstanding Balance
$264,666
Interest Rate
4.92%
Mortgage Type
FHA
Estimated Equity
$774,444
Purchase Details
Closed on
Aug 21, 2003
Sold by
Cass Ben T
Bought by
Cass Ben T and Cass Sharon K
Home Financials for this Owner
Home Financials are based on the most recent Mortgage that was taken out on this home.
Original Mortgage
$100,000
Interest Rate
5.46%
Mortgage Type
Credit Line Revolving
Purchase Details
Closed on
Apr 4, 2003
Sold by
Cass Sharon K
Bought by
Cass Ben T
Home Financials for this Owner
Home Financials are based on the most recent Mortgage that was taken out on this home.
Original Mortgage
$186,000
Interest Rate
5.73%
Create a Home Valuation Report for This Property
The Home Valuation Report is an in-depth analysis detailing your home's value as well as a comparison with similar homes in the area
Home Values in the Area
Average Home Value in this Area
Purchase History
| Date | Buyer | Sale Price | Title Company |
|---|---|---|---|
| Schagh Terry S | $425,000 | Nevada Title Las Vegas | |
| Cass Ben T | -- | Nevada Title Company | |
| Cass Ben T | -- | First American Title Company |
Source: Public Records
Mortgage History
| Date | Status | Borrower | Loan Amount |
|---|---|---|---|
| Open | Schagh Terry S | $407,000 | |
| Previous Owner | Cass Ben T | $100,000 | |
| Previous Owner | Cass Ben T | $186,000 |
Source: Public Records
Tax History Compared to Growth
Tax History
| Year | Tax Paid | Tax Assessment Tax Assessment Total Assessment is a certain percentage of the fair market value that is determined by local assessors to be the total taxable value of land and additions on the property. | Land | Improvement |
|---|---|---|---|---|
| 2025 | $4,911 | $250,992 | $70,000 | $180,992 |
| 2024 | $4,768 | $250,992 | $70,000 | $180,992 |
| 2023 | $4,768 | $231,789 | $61,250 | $170,539 |
| 2022 | $4,629 | $210,461 | $54,250 | $156,211 |
| 2021 | $4,495 | $197,885 | $49,000 | $148,885 |
| 2020 | $4,361 | $196,608 | $49,000 | $147,608 |
| 2019 | $4,234 | $188,914 | $43,750 | $145,164 |
| 2018 | $4,110 | $175,585 | $35,000 | $140,585 |
| 2017 | $4,968 | $169,396 | $26,250 | $143,146 |
| 2016 | $3,891 | $169,514 | $26,250 | $143,264 |
| 2015 | $3,885 | $162,394 | $21,000 | $141,394 |
| 2014 | $3,827 | $153,120 | $15,750 | $137,370 |
Source: Public Records
Map
Nearby Homes
- 7030 Schirlls St
- 6971 Arville St
- 7028 Connor Cove St
- 6851 Milos Rd
- 6995 Rogers St
- Luminary Plan at Daylight
- Layton Plan at Daylight
- Royalty II Plan at Daylight
- Royalty Plan at Daylight
- Kitchell Plan at Daylight
- 7199 Twilight Rider Ct
- 4222 W Warm Springs Rd
- 7270 Hinson St
- 3978 Jacob Lake Cir
- 6965 S Valley View Blvd
- 4490 W Warm Springs Rd
- 3906 Jacob Lake Cir
- 4536 W Warm Springs Rd
- 7210 El Malpais St
- 7118 Painted Skyline St
- 7045 Schirlls St
- 4300 W Arby Ave
- 7035 Schirlls St
- 7060 Schirlls St
- 4240 W Arby Ave
- 4340 W Arby Ave
- 7015 Schirlls St
- 4204 W Arby Ave
- 4335 Badura Ave
- 7060 Arville St
- 7070 Arville St
- 4241 W Arby Ave
- 7040 Arville St
- 4155 Badura Ave
- 7080 Arville St
- 7030 Arville St
- 4221 W Arby Ave
- 6995 Schirlls St
- 7020 Arville St