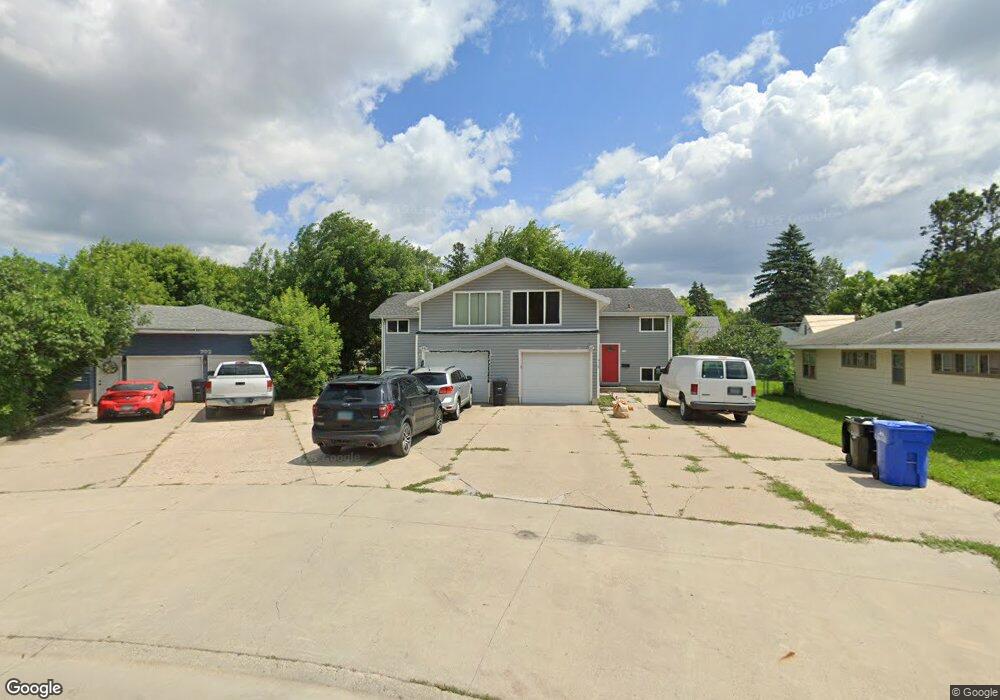
708 18th St S Fargo, ND 58103
Jefferson-Carl NeighborhoodEstimated Value: $301,000 - $350,747
--
Bed
--
Bath
3,244
Sq Ft
$99/Sq Ft
Est. Value
About This Home
This home is located at 708 18th St S, Fargo, ND 58103 and is currently estimated at $321,187, approximately $99 per square foot. 708 18th St S is a home located in Cass County with nearby schools including Jefferson Elementary School, Carl Ben Eielson Middle School, and South High School.
Ownership History
Date
Name
Owned For
Owner Type
Purchase Details
Closed on
Nov 8, 2024
Sold by
Day Joseph T
Bought by
Matney Anthony J
Current Estimated Value
Home Financials for this Owner
Home Financials are based on the most recent Mortgage that was taken out on this home.
Original Mortgage
$315,425
Outstanding Balance
$312,261
Interest Rate
6.08%
Mortgage Type
FHA
Estimated Equity
$8,926
Purchase Details
Closed on
Nov 22, 2017
Sold by
Derheim Troy D and Derheim Abigail
Bought by
Day Joseph T
Home Financials for this Owner
Home Financials are based on the most recent Mortgage that was taken out on this home.
Original Mortgage
$233,689
Interest Rate
3.5%
Mortgage Type
FHA
Create a Home Valuation Report for This Property
The Home Valuation Report is an in-depth analysis detailing your home's value as well as a comparison with similar homes in the area
Home Values in the Area
Average Home Value in this Area
Purchase History
| Date | Buyer | Sale Price | Title Company |
|---|---|---|---|
| Matney Anthony J | $335,000 | The Title Company | |
| Day Joseph T | $238,000 | Title Co |
Source: Public Records
Mortgage History
| Date | Status | Borrower | Loan Amount |
|---|---|---|---|
| Open | Matney Anthony J | $315,425 | |
| Previous Owner | Day Joseph T | $233,689 |
Source: Public Records
Tax History Compared to Growth
Tax History
| Year | Tax Paid | Tax Assessment Tax Assessment Total Assessment is a certain percentage of the fair market value that is determined by local assessors to be the total taxable value of land and additions on the property. | Land | Improvement |
|---|---|---|---|---|
| 2024 | $4,105 | $143,850 | $21,050 | $122,800 |
| 2023 | $4,084 | $143,850 | $21,050 | $122,800 |
| 2022 | $3,815 | $130,750 | $21,050 | $109,700 |
| 2021 | $3,465 | $118,850 | $21,050 | $97,800 |
| 2020 | $3,279 | $118,850 | $21,050 | $97,800 |
| 2019 | $3,419 | $124,750 | $12,500 | $112,250 |
| 2018 | $3,374 | $124,750 | $12,500 | $112,250 |
| 2017 | $3,339 | $124,750 | $12,500 | $112,250 |
| 2016 | $2,749 | $113,400 | $12,500 | $100,900 |
| 2015 | $2,214 | $85,050 | $8,550 | $76,500 |
| 2014 | $1,983 | $73,950 | $8,550 | $65,400 |
| 2013 | $2,029 | $73,950 | $8,550 | $65,400 |
Source: Public Records
Map
Nearby Homes
- 813 17th St S
- 814 19th St S
- 818 19th St S
- 1637 10th Ave S
- 1517 9th Ave S
- 2126 5th Ave S
- 1529 4th Ave S
- 2209 6th Ave S
- 2213 5th Ave S
- 1610 2nd Ave S
- 1629 2nd Ave S
- 1419 5th Ave S
- 1709 13th Ave S
- 1129 22nd St S Unit B09
- 1129 22nd St S Unit B12
- 402 23rd St S
- 1425 4th Ave S
- 1414 10th Ave S
- 2009 13th Ave S
- 2013 13th Ave S