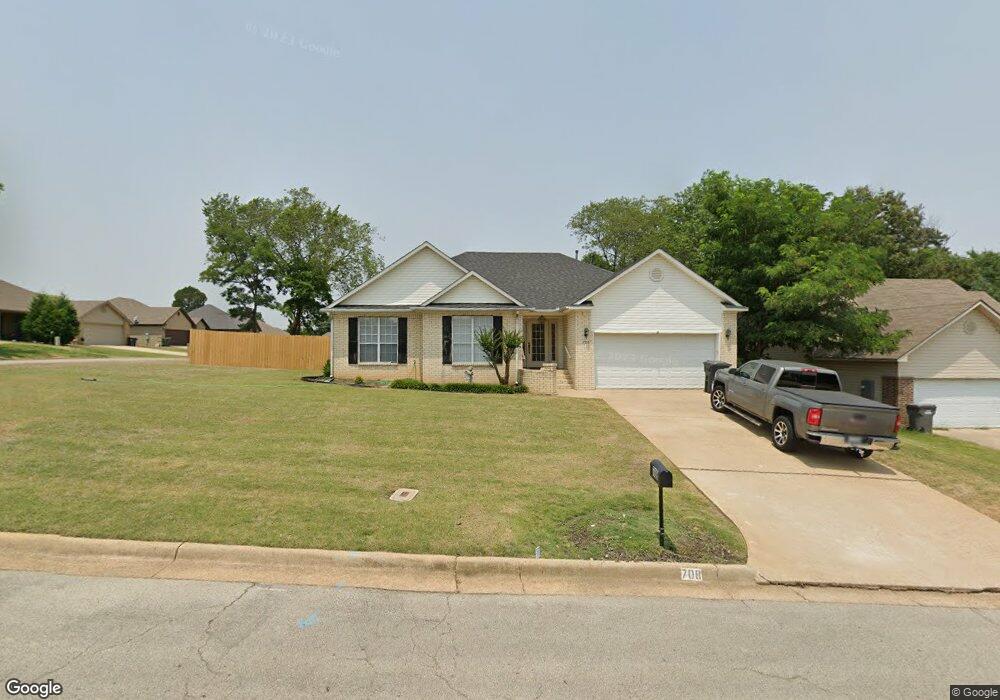
708 Amberwood Cove Jonesboro, AR 72401
Estimated Value: $224,982 - $246,000
--
Bed
2
Baths
1,987
Sq Ft
$119/Sq Ft
Est. Value
About This Home
This home is located at 708 Amberwood Cove, Jonesboro, AR 72401 and is currently estimated at $236,246, approximately $118 per square foot. 708 Amberwood Cove is a home located in Craighead County with nearby schools including Annie Camp Junior High School, The Academies at Jonesboro High School, and Concordia Christian Academy.
Ownership History
Date
Name
Owned For
Owner Type
Purchase Details
Closed on
Oct 4, 2012
Sold by
Mitchell Brenda S and Mitchell David M
Bought by
Mitchell David M and Mitchell Brenda S
Current Estimated Value
Home Financials for this Owner
Home Financials are based on the most recent Mortgage that was taken out on this home.
Original Mortgage
$111,900
Outstanding Balance
$77,633
Interest Rate
3.55%
Mortgage Type
New Conventional
Estimated Equity
$158,613
Purchase Details
Closed on
Nov 6, 2002
Bought by
Mitchell
Purchase Details
Closed on
Aug 27, 2002
Bought by
Fed National Mort
Purchase Details
Closed on
Aug 2, 2002
Bought by
Chase Manhattan
Purchase Details
Closed on
Jul 7, 2000
Bought by
Pugh
Purchase Details
Closed on
Jun 9, 2000
Bought by
Pugh
Purchase Details
Closed on
Apr 3, 1998
Bought by
Fulton
Purchase Details
Closed on
Oct 17, 1997
Bought by
Harrison
Purchase Details
Closed on
Aug 20, 1996
Bought by
Locke
Create a Home Valuation Report for This Property
The Home Valuation Report is an in-depth analysis detailing your home's value as well as a comparison with similar homes in the area
Home Values in the Area
Average Home Value in this Area
Purchase History
| Date | Buyer | Sale Price | Title Company |
|---|---|---|---|
| Mitchell David M | -- | Lenders Title Company | |
| Mitchell | $60,000 | -- | |
| Fed National Mort | -- | -- | |
| Chase Manhattan | -- | -- | |
| Pugh | -- | -- | |
| Pugh | -- | -- | |
| Fulton | $137,000 | -- | |
| Harrison | $126,000 | -- | |
| Locke | $25,000 | -- |
Source: Public Records
Mortgage History
| Date | Status | Borrower | Loan Amount |
|---|---|---|---|
| Open | Mitchell David M | $111,900 |
Source: Public Records
Tax History Compared to Growth
Tax History
| Year | Tax Paid | Tax Assessment Tax Assessment Total Assessment is a certain percentage of the fair market value that is determined by local assessors to be the total taxable value of land and additions on the property. | Land | Improvement |
|---|---|---|---|---|
| 2025 | $1,312 | $40,174 | $4,540 | $35,634 |
| 2024 | $1,312 | $40,174 | $4,540 | $35,634 |
| 2023 | $856 | $42,464 | $4,540 | $37,924 |
| 2022 | $906 | $42,464 | $4,540 | $37,924 |
| 2021 | $937 | $33,510 | $4,540 | $28,970 |
| 2020 | $937 | $33,510 | $4,540 | $28,970 |
| 2019 | $937 | $33,510 | $4,540 | $28,970 |
| 2018 | $962 | $33,510 | $4,540 | $28,970 |
| 2017 | $962 | $33,510 | $4,540 | $28,970 |
| 2016 | $962 | $31,090 | $4,400 | $26,690 |
| 2015 | $1,312 | $31,090 | $4,400 | $26,690 |
| 2014 | $962 | $31,090 | $4,400 | $26,690 |
Source: Public Records
Map
Nearby Homes
- 700 Amberwood Cove
- 795 S Hill Dr
- 806 Amberwood Cove
- 800 Southwest Dr
- 900 Melton Dr
- 724 Locust Dr
- 2311 Wood St
- 2318 Redbud Dr
- 2305 Anne St
- 3806 S Culberhouse Rd
- 1702 Roleson Ln
- 718 Owens Ave
- 1202 Wood Cove
- 18 Acres Parker Rd and Paula Dr
- 555 W Parker Rd
- 0 Parker Rd and Paula Dr
- 3015 Brianna Cove
- 3019 Brianna Dr
- 306 Cloverdale Cove
- 2005 Wood St
- 706 Amberwood Cove
- 807 Andrea Dr
- 0 Andrea Unit 15033153
- 0 Andrea Unit 16035235
- 800 Amberwood Cove
- 803 Andrea Dr
- 704 Amberwood Cove
- 709 Amberwood Cove
- 808 Andrea Dr
- 707 Amberwood Cove
- 711 Amberwood Cove
- 804 Andrea Dr
- 799 Andrea Dr
- 705 Amberwood Cove
- 802 Amberwood Cove
- 801 Amberwood Cove
- 702 Amberwood Cove
- 800 Andrea Dr
- 795 Andrea Dr
- 803 Amberwood Cove