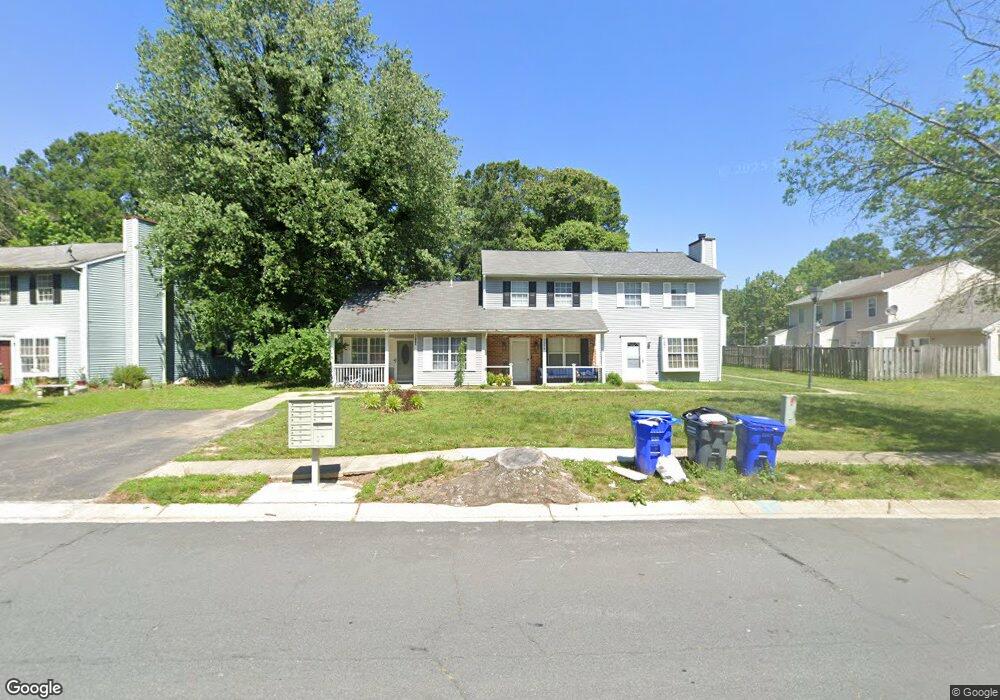
708 Barrington Dr Waldorf, MD 20602
Estimated Value: $268,000 - $297,178
2
Beds
2
Baths
744
Sq Ft
$387/Sq Ft
Est. Value
About This Home
This home is located at 708 Barrington Dr, Waldorf, MD 20602 and is currently estimated at $287,795, approximately $386 per square foot. 708 Barrington Dr is a home located in Charles County with nearby schools including Dr. Samuel A. Mudd Elementary School, John Hanson Middle School, and Thomas Stone High School.
Ownership History
Date
Name
Owned For
Owner Type
Purchase Details
Closed on
May 31, 2023
Sold by
Simpson Joseph Arthur
Bought by
Latay Williams
Current Estimated Value
Home Financials for this Owner
Home Financials are based on the most recent Mortgage that was taken out on this home.
Original Mortgage
$288,440
Outstanding Balance
$277,018
Interest Rate
6.39%
Mortgage Type
FHA
Estimated Equity
$10,777
Purchase Details
Closed on
Dec 11, 1986
Sold by
Campi, Inc
Bought by
Simpson Joseph A and Simpson Valerie L
Home Financials for this Owner
Home Financials are based on the most recent Mortgage that was taken out on this home.
Original Mortgage
$66,000
Interest Rate
9.3%
Purchase Details
Closed on
Sep 3, 1985
Sold by
St Charles Associates
Bought by
Campi, Inc
Home Financials for this Owner
Home Financials are based on the most recent Mortgage that was taken out on this home.
Original Mortgage
$93,600
Interest Rate
12.11%
Create a Home Valuation Report for This Property
The Home Valuation Report is an in-depth analysis detailing your home's value as well as a comparison with similar homes in the area
Home Values in the Area
Average Home Value in this Area
Purchase History
| Date | Buyer | Sale Price | Title Company |
|---|---|---|---|
| Latay Williams | $298,400 | Grace Title | |
| Simpson Joseph A | $71,500 | -- | |
| Campi, Inc | $117,000 | -- |
Source: Public Records
Mortgage History
| Date | Status | Borrower | Loan Amount |
|---|---|---|---|
| Open | Latay Williams | $288,440 | |
| Previous Owner | Simpson Joseph A | $66,000 | |
| Previous Owner | Campi, Inc | $93,600 |
Source: Public Records
Tax History Compared to Growth
Tax History
| Year | Tax Paid | Tax Assessment Tax Assessment Total Assessment is a certain percentage of the fair market value that is determined by local assessors to be the total taxable value of land and additions on the property. | Land | Improvement |
|---|---|---|---|---|
| 2025 | $7,207 | $219,700 | -- | -- |
| 2024 | $2,762 | $185,300 | $90,000 | $95,300 |
| 2023 | $2,544 | $178,000 | $0 | $0 |
| 2022 | $2,139 | $170,700 | $0 | $0 |
| 2021 | $2,397 | $163,400 | $85,000 | $78,400 |
| 2020 | $2,224 | $152,433 | $0 | $0 |
| 2019 | $2,060 | $141,467 | $0 | $0 |
| 2018 | $1,719 | $130,500 | $75,000 | $55,500 |
| 2017 | $1,789 | $127,933 | $0 | $0 |
| 2016 | -- | $125,367 | $0 | $0 |
| 2015 | $1,819 | $122,800 | $0 | $0 |
| 2014 | $1,819 | $122,800 | $0 | $0 |
Source: Public Records
Map
Nearby Homes
- 717 Barrington Dr
- 3864 Kelly Green Place
- 801 Roxbury Ct
- 3893 Light Arms Place
- 314 Rivermont Dr
- 3809 Light Arms Place
- 3839 Kearnys Inn Place
- 3071 Donegal Ct
- 3729 Kempsford Field Place
- 3081 Dorsey Ct
- 302 Barksdale Ave
- 2625 Ferguson Ct
- 3205 High Timber Ct
- 0 Smallwood Dr Unit MDCH2031694
- 3037 Heathcote Rd
- 3048 Heathcote Rd
- 3046 Heathcote Rd
- 2009 Wakefield Cir
- 1016 Stone Ave
- 221 Brent Rd
- 708 Barrington Dr Unit 14C
- 708A Barrington Dr
- 708 Barrington Drive A
- 708B Barrington Dr
- 708C Barrington Dr
- 710C Barrington Dr
- 710B Barrington Dr
- 710A Barrington Dr
- 706A Brandon Rd
- 706B Brandon Rd
- 706C Brandon Rd
- 706 Brandon Rd Unit A
- 706 Brandon Rd Unit 13C
- 706 Brandon Rd Unit 13B
- 706 Brandon Rd Unit 13A
- 823 Roxbury Ct
- 713 Barrington Dr
- 811A Brandon Rd
- 712C Barrington Dr
- 715 Barrington Dr