Estimated Value: $325,336 - $365,000
3
Beds
2
Baths
1,922
Sq Ft
$181/Sq Ft
Est. Value
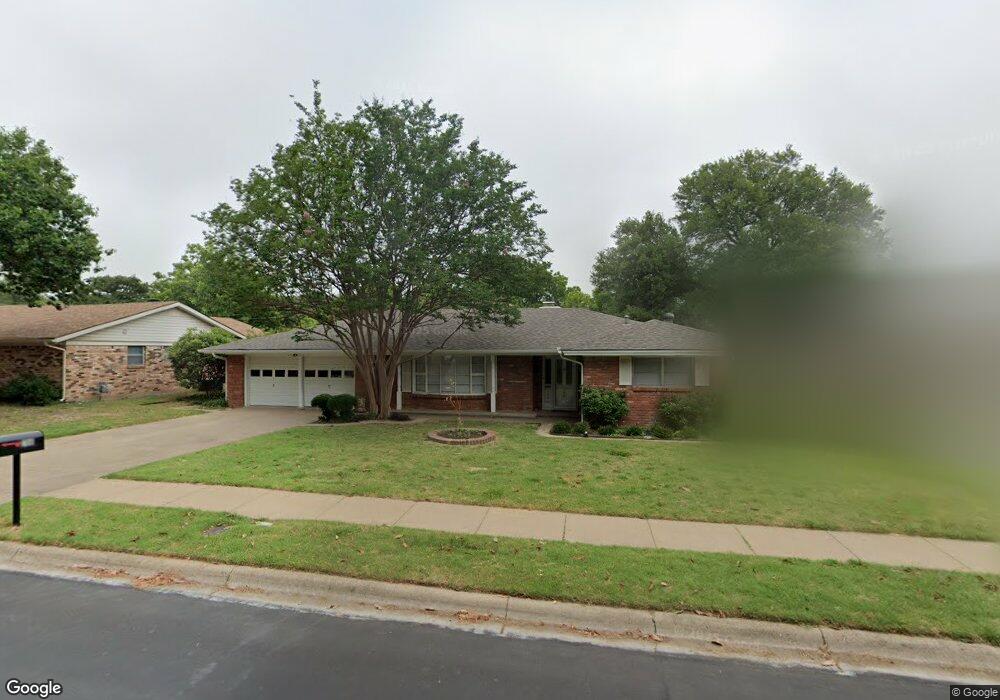
About This Home
This home is located at 708 Bedford Ct W, Hurst, TX 76053 and is currently estimated at $347,084, approximately $180 per square foot. 708 Bedford Ct W is a home located in Tarrant County with nearby schools including Donna Park Elementary, Bedford Junior High School, and L.D. Bell High School.
Ownership History
Date
Name
Owned For
Owner Type
Purchase Details
Closed on
Feb 2, 2021
Sold by
Littlejohn Ronald and Littlejohn Gina
Bought by
Long Real Estate Investments Lp
Current Estimated Value
Purchase Details
Closed on
Oct 13, 2020
Sold by
Nix Louise B and Nix Billie Louise
Bought by
Littlejohn Ronald and Littlejohn Gina
Create a Home Valuation Report for This Property
The Home Valuation Report is an in-depth analysis detailing your home's value as well as a comparison with similar homes in the area
Home Values in the Area
Average Home Value in this Area
Purchase History
| Date | Buyer | Sale Price | Title Company |
|---|---|---|---|
| Long Real Estate Investments Lp | -- | Providence Title Company | |
| Long Real Estate Investments Lp | -- | Providence Title Company | |
| Littlejohn Ronald | -- | None Available |
Source: Public Records
Tax History Compared to Growth
Tax History
| Year | Tax Paid | Tax Assessment Tax Assessment Total Assessment is a certain percentage of the fair market value that is determined by local assessors to be the total taxable value of land and additions on the property. | Land | Improvement |
|---|---|---|---|---|
| 2025 | $5,675 | $227,611 | $60,000 | $167,611 |
| 2024 | $5,675 | $277,846 | $60,000 | $217,846 |
| 2023 | $5,463 | $272,682 | $50,000 | $222,682 |
| 2022 | $6,032 | $261,969 | $50,000 | $211,969 |
| 2021 | $5,743 | $238,128 | $50,000 | $188,128 |
| 2020 | $4,448 | $223,405 | $50,000 | $173,405 |
| 2019 | $4,114 | $226,504 | $50,000 | $176,504 |
| 2018 | $1,064 | $152,799 | $20,000 | $132,799 |
| 2017 | $3,515 | $174,972 | $20,000 | $154,972 |
| 2016 | $3,196 | $173,932 | $20,000 | $153,932 |
| 2015 | $1,073 | $114,800 | $15,000 | $99,800 |
| 2014 | $1,073 | $114,800 | $15,000 | $99,800 |
Source: Public Records
Map
Nearby Homes
- 713 Edgehill Dr
- 1145 Terrace Trail
- 820 Bedford Ct W
- 1208 Birch St
- 632 Forest Ln
- 833 W Cheryl Ave
- 1204 Princess Ln
- 829 Joanna Dr
- 853 Royal Terrace
- 1208 Karla Dr
- 1001 Livingston Dr
- 400 Joanna Dr
- 1016 Billie Ruth Ln
- 420 Bedford Ct W
- 409 Vicki Place
- 916 Zelda Dr
- 913 Zelda Dr
- 1220 Woodland Park Dr
- 1230 Woodland Park Dr
- 1218 Wooded Trail
- 712 Bedford Ct W
- 704 Bedford Ct W
- 705 Mountain Terrace
- 716 Bedford Ct W
- 700 Bedford Ct W
- 701 Mountain Terrace
- 709 Bedford Ct W
- 1141 Forest Oaks Ln
- 705 Bedford Ct W
- 709 Mountain Terrace
- 713 Bedford Ct W
- 1145 Forest Oaks Ln
- 701 Bedford Ct W
- 720 Bedford Ct W
- 717 Bedford Ct W
- 713 Mountain Terrace
- 708 Edgehill Dr
- 721 Bedford Ct W
- 704 Edgehill Dr
- 712 Edgehill Dr