Estimated Value: $115,000 - $160,000
--
Bed
--
Bath
932
Sq Ft
$148/Sq Ft
Est. Value
About This Home
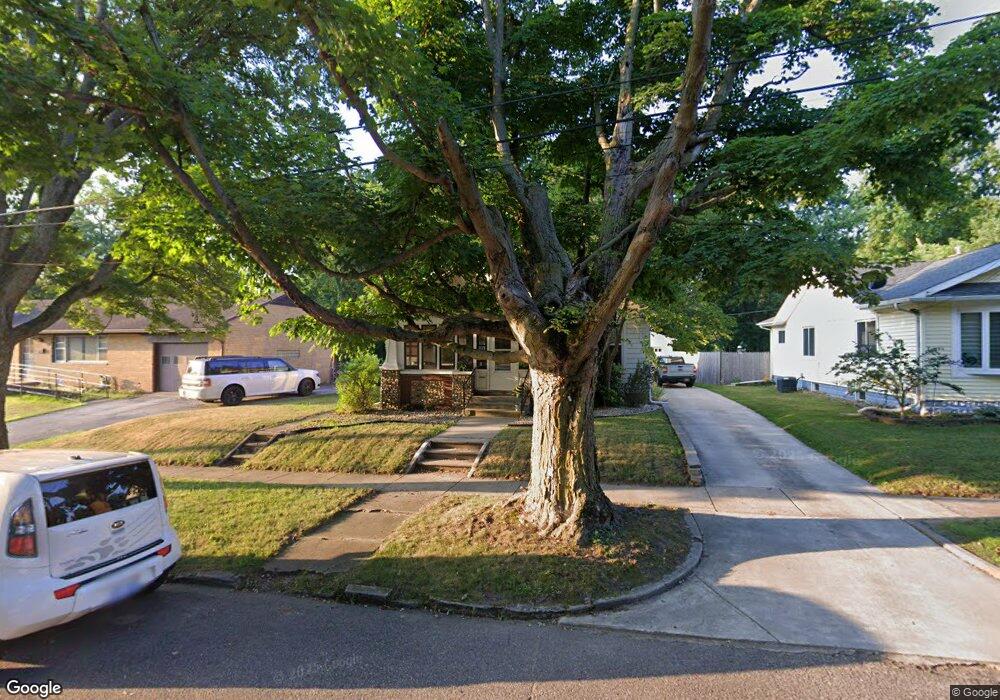
This home is located at 708 Clay St, Niles, MI 49120 and is currently estimated at $138,319, approximately $148 per square foot. 708 Clay St is a home located in Berrien County with nearby schools including Ballard Elementary School, Oak Manor Sixth Grade Center, and Ring Lardner Middle School.
Ownership History
Date
Name
Owned For
Owner Type
Purchase Details
Closed on
Aug 10, 2020
Sold by
Wiese Jon A
Bought by
Wiese Jon A and Wiese Jon A
Current Estimated Value
Purchase Details
Closed on
Oct 4, 2018
Sold by
Wiese Jon A
Bought by
Wiese Jon A and Wiese Donna R
Purchase Details
Closed on
Aug 16, 1995
Purchase Details
Closed on
Jul 1, 1994
Purchase Details
Closed on
Feb 22, 1994
Purchase Details
Closed on
Jun 13, 1986
Create a Home Valuation Report for This Property
The Home Valuation Report is an in-depth analysis detailing your home's value as well as a comparison with similar homes in the area
Home Values in the Area
Average Home Value in this Area
Purchase History
| Date | Buyer | Sale Price | Title Company |
|---|---|---|---|
| Wiese Jon A | -- | None Listed On Document | |
| Wiese Jon A | -- | None Available | |
| -- | $37,000 | -- | |
| -- | -- | -- | |
| -- | $37,000 | -- | |
| -- | -- | -- | |
| -- | -- | -- |
Source: Public Records
Tax History Compared to Growth
Tax History
| Year | Tax Paid | Tax Assessment Tax Assessment Total Assessment is a certain percentage of the fair market value that is determined by local assessors to be the total taxable value of land and additions on the property. | Land | Improvement |
|---|---|---|---|---|
| 2025 | $1,226 | $61,900 | $0 | $0 |
| 2024 | $957 | $57,700 | $0 | $0 |
| 2023 | $918 | $53,200 | $0 | $0 |
| 2022 | $874 | $57,100 | $0 | $0 |
| 2021 | $1,076 | $49,800 | $3,700 | $46,100 |
| 2020 | $1,065 | $51,200 | $0 | $0 |
| 2019 | $1,051 | $40,900 | $1,700 | $39,200 |
| 2018 | $1,017 | $40,900 | $0 | $0 |
| 2017 | $1,000 | $34,700 | $0 | $0 |
| 2016 | $873 | $31,300 | $0 | $0 |
| 2015 | $870 | $33,200 | $0 | $0 |
| 2014 | $675 | $33,000 | $0 | $0 |
Source: Public Records
Map
Nearby Homes
- 537 Grant St
- 124 S State St
- 211 S Street Joseph Ave
- 413 S Street Joseph Ave
- V/L Wesaw Rd
- 211 S 4th St
- 1010 Tomahawk Ln
- 319 S 5th St
- 712 Maple St
- 705 Oak St
- 709 Regent St
- VL Huron St
- 98 River St
- 300 Carefree Ct
- 211 N 8th St
- Integrity 1610 Plan at Carefree Villas
- Integrity 1605 Plan at Carefree Villas
- Integrity 1250 Plan at Carefree Villas
- Integrity 1530 Plan at Carefree Villas
- 340 Carefree Ct