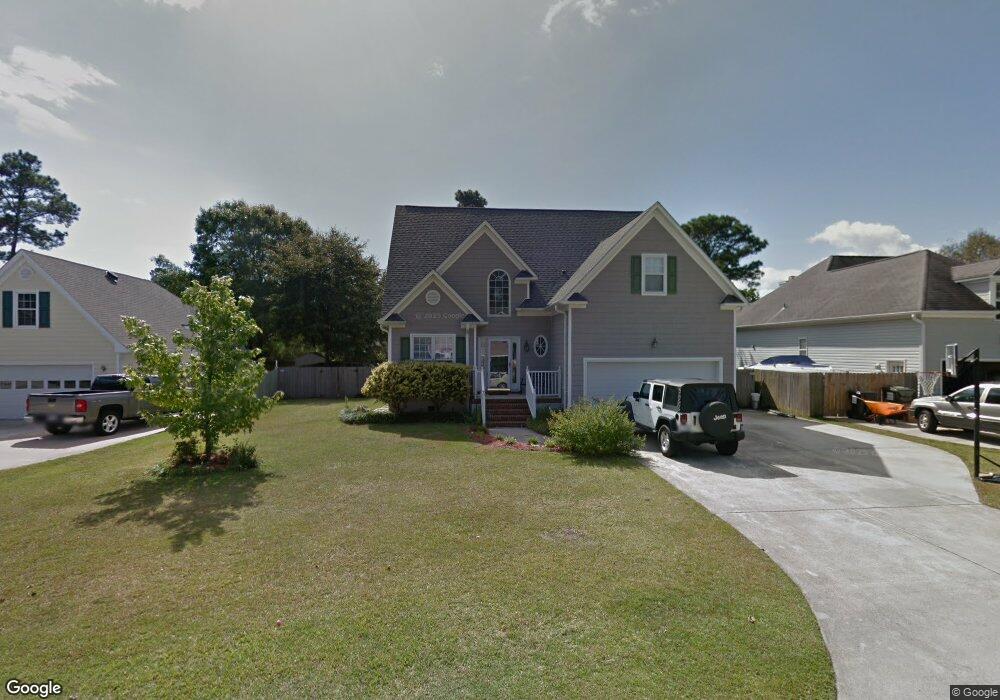
708 Crows Nest Ct Wilmington, NC 28409
Estimated Value: $444,000 - $521,031
4
Beds
3
Baths
2,400
Sq Ft
$203/Sq Ft
Est. Value
About This Home
This home is located at 708 Crows Nest Ct, Wilmington, NC 28409 and is currently estimated at $487,758, approximately $203 per square foot. 708 Crows Nest Ct is a home located in New Hanover County with nearby schools including Heyward C. Bellamy Elementary School, Myrtle Grove Middle School, and Eugene Ashley High School.
Ownership History
Date
Name
Owned For
Owner Type
Purchase Details
Closed on
Aug 18, 2020
Sold by
Berry Bruce D and Prehoda Leah M
Bought by
Berry Bruce D and Prehoda Leah M
Current Estimated Value
Purchase Details
Closed on
Jan 20, 2016
Sold by
Berry Bruce D
Bought by
Berry Bruce D and Prehoda Leah M
Home Financials for this Owner
Home Financials are based on the most recent Mortgage that was taken out on this home.
Original Mortgage
$187,200
Outstanding Balance
$148,981
Interest Rate
3.98%
Mortgage Type
New Conventional
Estimated Equity
$338,777
Purchase Details
Closed on
Feb 18, 1998
Sold by
Sands Nicholas P Ruth Rosche
Bought by
Berry Bruce D
Purchase Details
Closed on
Sep 12, 1997
Sold by
Brookside Builders Jacksonvlle
Bought by
Sands Nicholas P Ruth Rosche
Purchase Details
Closed on
Jan 31, 1995
Sold by
Brookside Builders Jacksonvlle
Bought by
Sands Nicholas P Ruth Rosche
Purchase Details
Closed on
Aug 10, 1994
Sold by
Omni Homes Inc
Bought by
Brookside Builders Inc
Purchase Details
Closed on
Mar 12, 1993
Sold by
Oleander Development Co
Bought by
Omni Homes Inc
Create a Home Valuation Report for This Property
The Home Valuation Report is an in-depth analysis detailing your home's value as well as a comparison with similar homes in the area
Home Values in the Area
Average Home Value in this Area
Purchase History
| Date | Buyer | Sale Price | Title Company |
|---|---|---|---|
| Berry Bruce D | -- | None Available | |
| Berry Bruce D | -- | None Available | |
| Berry Bruce D | $149,000 | -- | |
| Sands Nicholas P Ruth Rosche | -- | -- | |
| Sands Nicholas P Ruth Rosche | $163,500 | -- | |
| Brookside Builders Inc | $22,500 | -- | |
| Omni Homes Inc | $330,000 | -- |
Source: Public Records
Mortgage History
| Date | Status | Borrower | Loan Amount |
|---|---|---|---|
| Open | Berry Bruce D | $187,200 |
Source: Public Records
Tax History Compared to Growth
Tax History
| Year | Tax Paid | Tax Assessment Tax Assessment Total Assessment is a certain percentage of the fair market value that is determined by local assessors to be the total taxable value of land and additions on the property. | Land | Improvement |
|---|---|---|---|---|
| 2025 | $1,945 | $494,500 | $114,100 | $380,400 |
| 2023 | $1,888 | $347,200 | $69,400 | $277,800 |
| 2022 | $1,899 | $347,200 | $69,400 | $277,800 |
| 2021 | $1,913 | $347,200 | $69,400 | $277,800 |
| 2020 | $1,660 | $262,500 | $52,000 | $210,500 |
| 2019 | $1,651 | $261,100 | $52,000 | $209,100 |
| 2018 | $1,651 | $261,100 | $52,000 | $209,100 |
| 2017 | $1,691 | $261,100 | $52,000 | $209,100 |
| 2016 | $1,231 | $177,600 | $52,000 | $125,600 |
| 2015 | $1,144 | $177,600 | $52,000 | $125,600 |
| 2014 | $1,124 | $177,600 | $52,000 | $125,600 |
Source: Public Records
Map
Nearby Homes
- 5705 Woodduck Cir
- 633 Piner Rd
- 758 Billmark Dr
- 234 Brighton Rd
- 301 Foxwood Ln
- 273 Foxwood Ln
- 141 Southwold Dr
- 5004 Laurenbridge Ln
- 5618 Pinecone Place
- 4922 Woods Edge Rd
- 4953 Coronado Dr
- 5225 Leisure Cir
- 5014 Helms Port Ave
- 653 Hidden Valley Rd
- 5353 Leisure Cir
- 4817 Wedgefield Dr
- 1508 Honeybee Ln
- 4829 Wedgefield Dr
- 5901 Misty Morning Ln
- 106 Hooks
- 712 Crows Nest Ct
- 705 Duck Downe Ct
- 701 Duck Downe Ct
- 700 Crows Nest Ct
- 709 Duck Downe Ct
- 713 Crows Nest Ct
- 705 Crows Nest Ct
- 713 Duck Downe Ct
- 701 Crows Nest Ct Unit 36
- 721 Crows Nest Ct
- 717 Crows Nest Ct
- 5808 Wood Duck Cir
- 5812 Wood Duck Cir
- 5816 Woodduck Cir
- 700 Duck Downe Ct
- 5812 Woodduck Cir
- 704 Duck Downe Ct
- 708 Mallard Crossing Dr
- 708 Mallard Crossing
- 712 Mallard Crossing Dr