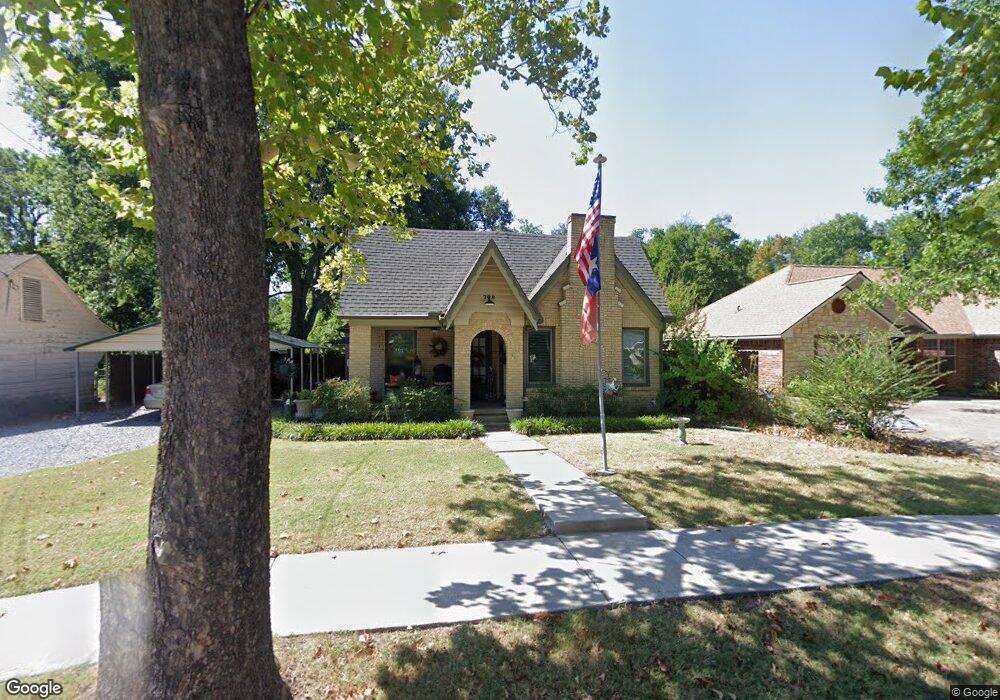
708 E 9th St Bonham, TX 75418
Estimated Value: $145,000 - $187,000
2
Beds
1
Bath
1,356
Sq Ft
$118/Sq Ft
Est. Value
About This Home
This home is located at 708 E 9th St, Bonham, TX 75418 and is currently estimated at $159,415, approximately $117 per square foot. 708 E 9th St is a home located in Fannin County with nearby schools including Evans Elementary School, Finley-Oates Elementary School, and LH Rather Jr High School.
Ownership History
Date
Name
Owned For
Owner Type
Purchase Details
Closed on
Feb 20, 2019
Sold by
Chambers Paula A
Bought by
White Dennis and White Sherry
Current Estimated Value
Purchase Details
Closed on
Aug 24, 2005
Sold by
Stark Georgia Ann
Bought by
Chambers Paula A
Home Financials for this Owner
Home Financials are based on the most recent Mortgage that was taken out on this home.
Original Mortgage
$56,000
Interest Rate
5.61%
Mortgage Type
New Conventional
Create a Home Valuation Report for This Property
The Home Valuation Report is an in-depth analysis detailing your home's value as well as a comparison with similar homes in the area
Purchase History
| Date | Buyer | Sale Price | Title Company |
|---|---|---|---|
| White Dennis | -- | Cole Title Co | |
| Chambers Paula A | -- | None Available |
Source: Public Records
Mortgage History
| Date | Status | Borrower | Loan Amount |
|---|---|---|---|
| Previous Owner | Chambers Paula A | $56,000 |
Source: Public Records
Tax History
| Year | Tax Paid | Tax Assessment Tax Assessment Total Assessment is a certain percentage of the fair market value that is determined by local assessors to be the total taxable value of land and additions on the property. | Land | Improvement |
|---|---|---|---|---|
| 2025 | $2,543 | $131,120 | $42,960 | $88,160 |
| 2024 | $2,379 | $122,650 | $40,910 | $81,740 |
| 2023 | $2,400 | $121,710 | $39,170 | $82,540 |
| 2022 | $2,392 | $108,750 | $27,510 | $81,240 |
| 2021 | $1,906 | $75,410 | $13,190 | $62,220 |
| 2020 | $1,764 | $69,020 | $10,330 | $58,690 |
| 2019 | $1,801 | $67,780 | $9,920 | $57,860 |
| 2018 | $1,794 | $81,790 | $9,720 | $72,070 |
| 2017 | $1,571 | $64,050 | $4,710 | $59,340 |
| 2016 | $1,428 | $55,880 | $4,710 | $51,170 |
| 2015 | -- | $50,120 | $4,500 | $45,620 |
| 2014 | -- | $48,480 | $3,650 | $44,830 |
Source: Public Records
Map
Nearby Homes
Your Personal Tour Guide
Ask me questions while you tour the home.