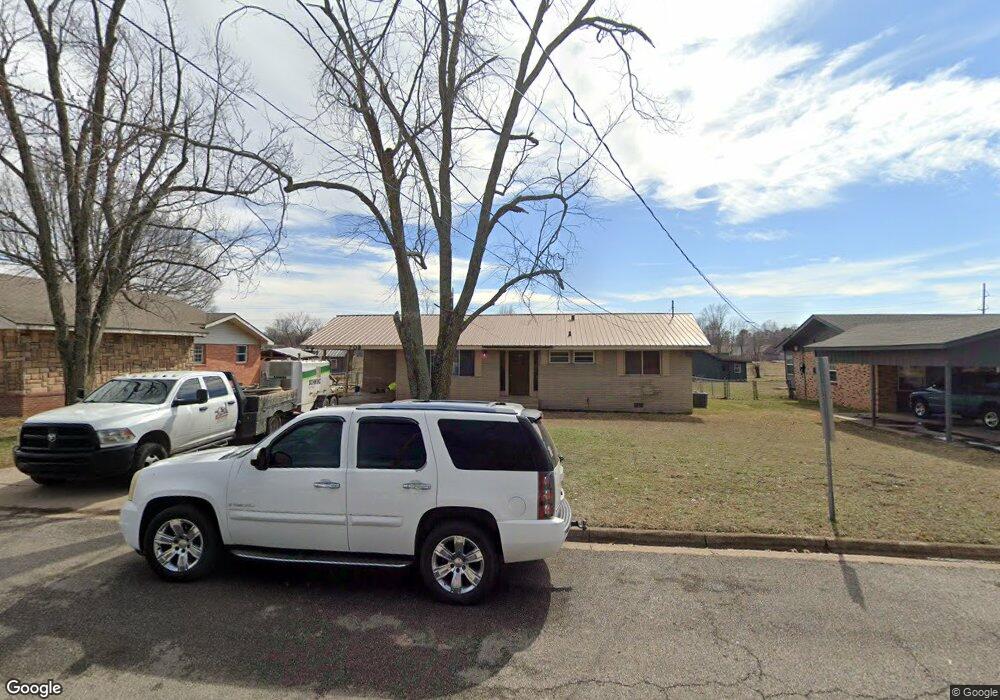
708 E Sumac St Rogers, AR 72756
Estimated Value: $218,124 - $288,000
Studio
2
Baths
1,355
Sq Ft
$190/Sq Ft
Est. Value
About This Home
This home is located at 708 E Sumac St, Rogers, AR 72756 and is currently estimated at $257,031, approximately $189 per square foot. 708 E Sumac St is a home located in Benton County with nearby schools including Eastside Elementary School, Lingle Middle School, and Rogers Heritage High School.
Ownership History
Date
Name
Owned For
Owner Type
Purchase Details
Closed on
Nov 13, 2019
Sold by
Ullom Elder G and Ullom Dionne P
Bought by
Ullom Elder G and Ullom Dionne P
Current Estimated Value
Purchase Details
Closed on
Jun 19, 2008
Sold by
Pittman Vernon E and Pittman Catherine
Bought by
Pittman Vernon and Pittman Catherine
Purchase Details
Closed on
Feb 7, 1963
Bought by
Pittman
Create a Home Valuation Report for This Property
The Home Valuation Report is an in-depth analysis detailing your home's value as well as a comparison with similar homes in the area
Home Values in the Area
Average Home Value in this Area
Purchase History
| Date | Buyer | Sale Price | Title Company |
|---|---|---|---|
| Ullom Elder G | -- | None Available | |
| Elder G Teresa | -- | None Available | |
| Ullom Dionne P | -- | None Available | |
| Pittman Vernon | -- | None Available | |
| Pittman Catherine | -- | None Available | |
| Pittman | $1,000 | -- |
Source: Public Records
Tax History
| Year | Tax Paid | Tax Assessment Tax Assessment Total Assessment is a certain percentage of the fair market value that is determined by local assessors to be the total taxable value of land and additions on the property. | Land | Improvement |
|---|---|---|---|---|
| 2025 | $1,481 | $35,242 | $8,000 | $27,242 |
| 2024 | $1,324 | $35,242 | $8,000 | $27,242 |
| 2023 | $1,203 | $23,940 | $6,000 | $17,940 |
| 2022 | $1,155 | $23,940 | $6,000 | $17,940 |
| 2021 | $1,056 | $23,940 | $6,000 | $17,940 |
| 2020 | $961 | $17,500 | $3,200 | $14,300 |
| 2019 | $961 | $17,500 | $3,200 | $14,300 |
| 2018 | $961 | $17,500 | $3,200 | $14,300 |
| 2017 | $828 | $17,500 | $3,200 | $14,300 |
| 2016 | $828 | $17,500 | $3,200 | $14,300 |
| 2015 | $764 | $14,450 | $4,000 | $10,450 |
| 2014 | $764 | $14,450 | $4,000 | $10,450 |
Source: Public Records
Map
Nearby Homes
- 1811 S H St
- 1706 S F St
- 1824 S G St
- 818 E Kiwi St
- 1809 S G St
- 1818 S H St
- 1006 E Longview Dr
- 1009 E Linden St
- 1813 S J St
- 1105 E Linden St
- Lot 12 S Breckenridge Loop
- 1909 & 1911 S F St
- 1014 S E St
- 1013 S E St
- 1006 S G St
- 1419 S Arkansas St
- 1023 S B St
- 0 S Pleasant Ridge Rd
- 2011 & 2013 S G St
- 109 Ruth Ln
Your Personal Tour Guide
Ask me questions while you tour the home.