Estimated Value: $318,114 - $368,000
3
Beds
2
Baths
2,159
Sq Ft
$159/Sq Ft
Est. Value
About This Home
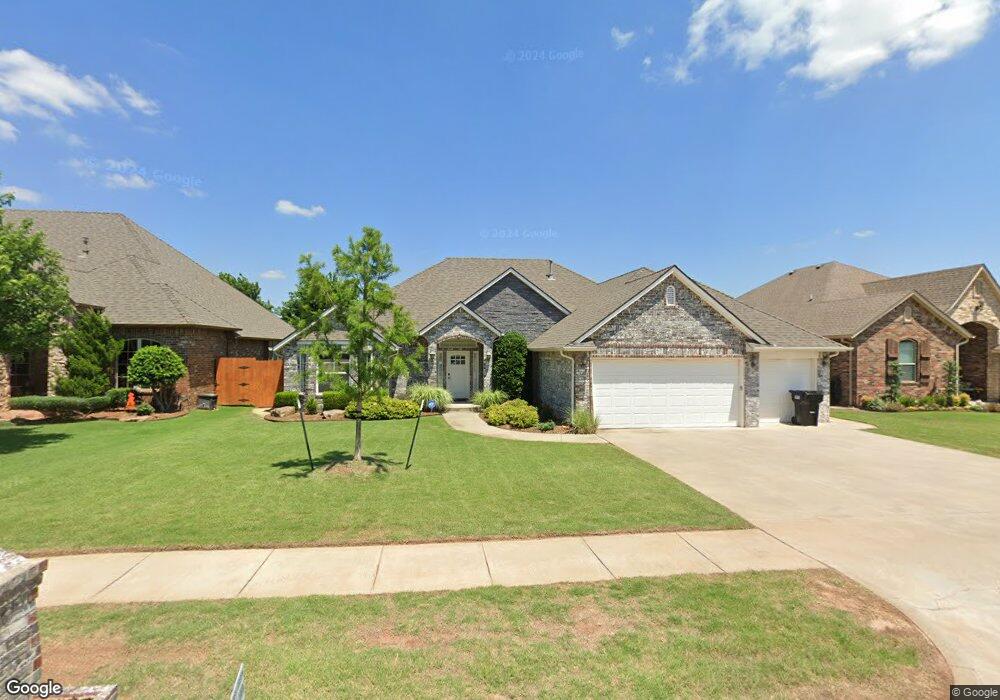
This home is located at 708 Lindsey Ln, Moore, OK 73160 and is currently estimated at $342,779, approximately $158 per square foot. 708 Lindsey Ln is a home with nearby schools including Heritage Trails Elementary School, Highland East Junior High School, and Moore High School.
Ownership History
Date
Name
Owned For
Owner Type
Purchase Details
Closed on
May 10, 2013
Sold by
Harpham Richard Wilbur and Harpham Mari Leigeber
Bought by
Harpham Richard W and Harpham Mari L
Current Estimated Value
Purchase Details
Closed on
Mar 31, 2011
Sold by
R & R Dream Homes Llc
Bought by
Harpham Richard Wilbur and Harpham Mari Leigeber
Home Financials for this Owner
Home Financials are based on the most recent Mortgage that was taken out on this home.
Original Mortgage
$186,504
Outstanding Balance
$10,180
Interest Rate
5.04%
Mortgage Type
New Conventional
Estimated Equity
$332,599
Purchase Details
Closed on
Dec 1, 2010
Sold by
R & R Land Development Llc
Bought by
R & R Dream Homes Llc
Home Financials for this Owner
Home Financials are based on the most recent Mortgage that was taken out on this home.
Original Mortgage
$179,000
Interest Rate
4.23%
Mortgage Type
Purchase Money Mortgage
Create a Home Valuation Report for This Property
The Home Valuation Report is an in-depth analysis detailing your home's value as well as a comparison with similar homes in the area
Home Values in the Area
Average Home Value in this Area
Purchase History
| Date | Buyer | Sale Price | Title Company |
|---|---|---|---|
| Harpham Richard W | -- | None Available | |
| Harpham Richard Wilbur | $233,500 | Fa | |
| R & R Dream Homes Llc | $41,000 | None Available |
Source: Public Records
Mortgage History
| Date | Status | Borrower | Loan Amount |
|---|---|---|---|
| Open | Harpham Richard Wilbur | $186,504 | |
| Previous Owner | R & R Dream Homes Llc | $179,000 |
Source: Public Records
Tax History Compared to Growth
Tax History
| Year | Tax Paid | Tax Assessment Tax Assessment Total Assessment is a certain percentage of the fair market value that is determined by local assessors to be the total taxable value of land and additions on the property. | Land | Improvement |
|---|---|---|---|---|
| 2024 | -- | $31,876 | $4,663 | $27,213 |
| 2023 | $3,650 | $30,948 | $4,731 | $26,217 |
| 2022 | $0 | $30,046 | $5,239 | $24,807 |
| 2021 | $3,501 | $29,171 | $5,045 | $24,126 |
| 2020 | $3,396 | $28,322 | $4,920 | $23,402 |
| 2019 | $3,577 | $28,246 | $4,920 | $23,326 |
| 2018 | $3,588 | $28,332 | $4,920 | $23,412 |
| 2017 | $3,607 | $28,332 | $0 | $0 |
| 2016 | $3,633 | $28,332 | $4,920 | $23,412 |
| 2015 | $3,315 | $28,574 | $4,920 | $23,654 |
| 2014 | $3,272 | $27,558 | $4,920 | $22,638 |
Source: Public Records
Map
Nearby Homes
- 2636 SE 7th St
- 2632 SE 7th St
- 2625 SE 8th St
- 2621 SE 5th St
- 0 S Sunnylane and Se 139th Unit 1187357
- 4401 SE 139th St
- 4400 SE 139th St
- 1109 Jacob Dr
- 1013 Kelsi Dr
- 1126 Jacob Dr
- 4620 SE 139th St
- 2433 SE 12th St
- 1336 Brice Dr
- 624 Applewood St
- 1308 Anns Place
- 2100 SE 5th St
- 1009 Ashwood Ln
- 930 Estell Dr
- 401 S Bryant Ave
- 705 Cottonwood Dr
- 704 Lindsey Ln
- 700 Lindsey Ln
- 709 Lindsey Ln
- 705 Lindsey Ln
- 617 Dayton Cir
- 713 Lindsey Ln
- 612 Lindsey Ln
- 804 Lindsey Ln
- 621 Dayton Cir
- 701 Lindsey Ln
- 801 Lindsey Ln
- 613 Dayton Cir
- 808 Lindsey Ln
- 805 Lindsey Ln
- 613 Lindsey Ln
- 608 Lindsey Ln
- 708 Samantha Ln
- 704 Samantha Ln
- 712 Samantha Ln
- 609 Dayton Cir