708 Maple St Sheffield, IA 50475
Estimated Value: $103,000 - $132,000
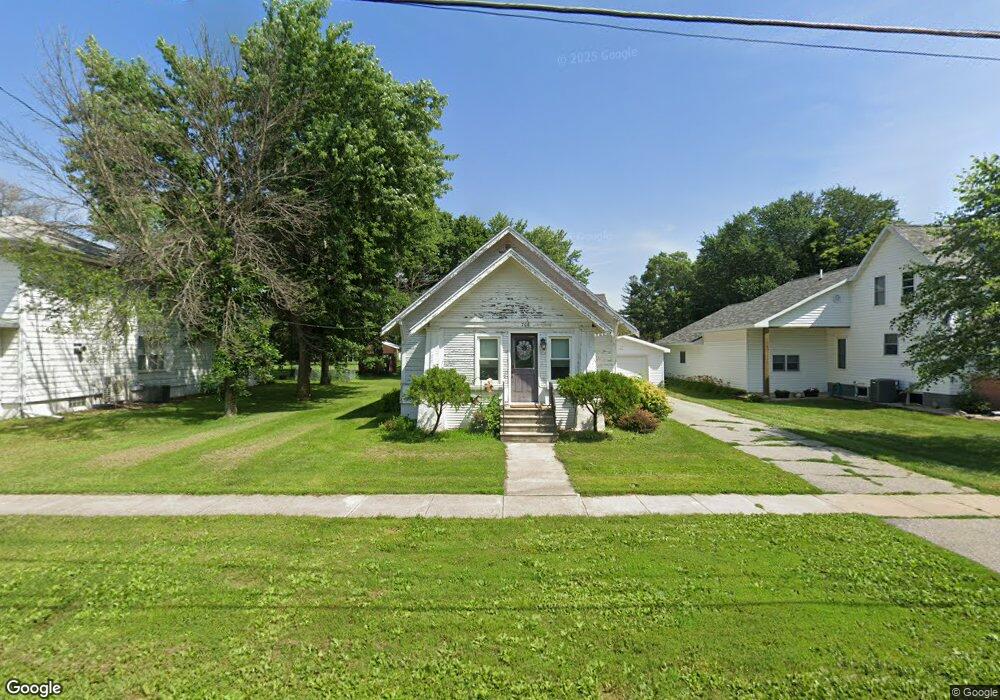
About This Home
This home is located at 708 Maple St, Sheffield, IA 50475 and is currently estimated at $121,517, approximately $58 per square foot. 708 Maple St is a home located in Franklin County with nearby schools including West Fork High School.
Ownership History
We collect this data history from publicly available records. To have your information removed, we recommend requesting removal directly through your county’s website.
Purchase Details
Home Financials for this Owner
Home Financials are based on the most recent Mortgage that was taken out on this home.Purchase Details
Home Financials for this Owner
Home Financials are based on the most recent Mortgage that was taken out on this home.Purchase History
We collect this data history from publicly available records. To have your information removed, we recommend requesting removal directly through your county’s website.
| Date | Buyer | Sale Price | Title Company |
|---|---|---|---|
| $64,500 | None Available | ||
| $53,500 | None Available |
Mortgage History
We collect this data history from publicly available records. To have your information removed, we recommend requesting removal directly through your county’s website.
| Date | Status | Borrower | Loan Amount |
|---|---|---|---|
| Open | $61,750 | ||
| Previous Owner | $55,590 |
Tax History
We collect this data history from publicly available records. To have your information removed, we recommend requesting removal directly through your county’s website.
| Year | Tax Paid | Tax Assessment Tax Assessment Total Assessment is a certain percentage of the fair market value that is determined by local assessors to be the total taxable value of land and additions on the property. | Land | Improvement |
|---|---|---|---|---|
| 2025 | $1,210 | $86,600 | $11,500 | $75,100 |
| 2024 | $1,210 | $79,400 | $11,500 | $67,900 |
| 2023 | $1,254 | $79,400 | $11,500 | $67,900 |
| 2022 | $1,034 | $72,700 | $11,500 | $61,200 |
| 2021 | $1,034 | $59,100 | $11,500 | $47,600 |
| 2020 | $1,180 | $57,000 | $11,500 | $45,500 |
| 2019 | $1,096 | $66,600 | $0 | $0 |
| 2018 | $1,054 | $66,600 | $0 | $0 |
| 2017 | $1,048 | $65,100 | $0 | $0 |
| 2016 | $1,050 | $65,100 | $0 | $0 |
| 2015 | $1,050 | $65,200 | $0 | $0 |
| 2014 | $1,078 | $65,200 | $0 | $0 |
Map
- 101 Southview Cir
- 718 Gilman St
- 202 Brickyard Ct
- 200 Brickyard Ct
- 220 Borst St
- 602 Claydigger Run
- 428 Brickyard Rd
- 410 Brickyard Rd
- 409 Brickyard Rd
- 421 Brickyard Rd
- 417 Brickyard Rd
- 419 Brickyard Rd
- 103 W Crescent Dr
- 416 Brickyard Rd
- 402 Brickyard Rd
- 411 Brickyard Rd
- 415 Brickyard Rd
- 400 Brickyard Rd
- 418 Brickyard Rd
- 600 Claydigger Run
Ask me questions while you tour the home.