Estimated Value: $347,000 - $398,000
3
Beds
2
Baths
1,745
Sq Ft
$210/Sq Ft
Est. Value
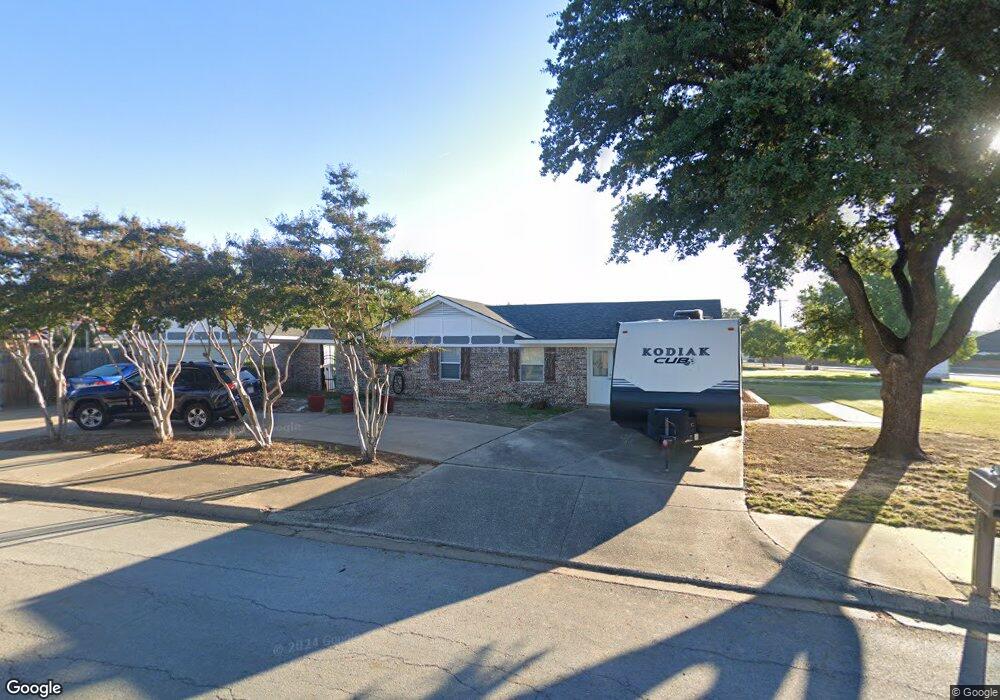
About This Home
This home is located at 708 Martin Rd, Hurst, TX 76054 and is currently estimated at $365,818, approximately $209 per square foot. 708 Martin Rd is a home located in Tarrant County with nearby schools including W.A. Porter Elementary School, Smithfield Middle School, and Birdville High School.
Ownership History
Date
Name
Owned For
Owner Type
Purchase Details
Closed on
Dec 3, 2021
Sold by
Lawton Kays Debbra
Bought by
Lawton Clayton Cole
Current Estimated Value
Home Financials for this Owner
Home Financials are based on the most recent Mortgage that was taken out on this home.
Original Mortgage
$162,000
Interest Rate
2.39%
Mortgage Type
Balloon
Purchase Details
Closed on
May 12, 2016
Sold by
Estate Of Dorothy L Key
Bought by
Kays Debbra Lawton
Purchase Details
Closed on
Jun 27, 2007
Sold by
Sims William E and Sims Jamie
Bought by
Key Dorothy
Purchase Details
Closed on
Jun 4, 1999
Sold by
Watson Stephen M and Watson Charlene A
Bought by
Sims William E
Home Financials for this Owner
Home Financials are based on the most recent Mortgage that was taken out on this home.
Original Mortgage
$95,951
Interest Rate
6.92%
Mortgage Type
FHA
Create a Home Valuation Report for This Property
The Home Valuation Report is an in-depth analysis detailing your home's value as well as a comparison with similar homes in the area
Home Values in the Area
Average Home Value in this Area
Purchase History
| Date | Buyer | Sale Price | Title Company |
|---|---|---|---|
| Lawton Clayton Cole | -- | None Listed On Document | |
| Kays Debbra Lawton | $150,000 | Attorney | |
| Key Dorothy | -- | None Available | |
| Sims William E | -- | Stewart Title |
Source: Public Records
Mortgage History
| Date | Status | Borrower | Loan Amount |
|---|---|---|---|
| Previous Owner | Lawton Clayton Cole | $162,000 | |
| Previous Owner | Sims William E | $95,951 |
Source: Public Records
Tax History
| Year | Tax Paid | Tax Assessment Tax Assessment Total Assessment is a certain percentage of the fair market value that is determined by local assessors to be the total taxable value of land and additions on the property. | Land | Improvement |
|---|---|---|---|---|
| 2025 | $4,710 | $343,503 | $60,000 | $283,503 |
| 2024 | $4,710 | $343,503 | $60,000 | $283,503 |
| 2023 | $5,908 | $280,000 | $60,000 | $220,000 |
| 2022 | $5,810 | $235,000 | $40,000 | $195,000 |
| 2021 | $6,393 | $246,431 | $40,000 | $206,431 |
| 2020 | $5,011 | $195,000 | $40,000 | $155,000 |
| 2019 | $5,125 | $195,000 | $40,000 | $155,000 |
| 2018 | $4,205 | $160,000 | $40,000 | $120,000 |
| 2017 | $4,269 | $160,000 | $40,000 | $120,000 |
| 2016 | $4,675 | $175,208 | $35,000 | $140,208 |
| 2015 | $3,777 | $140,800 | $20,000 | $120,800 |
| 2014 | $3,777 | $140,800 | $20,000 | $120,800 |
Source: Public Records
Map
Nearby Homes
- 2701 Hurstview Dr
- 712 Springhill Dr
- 736 Springhill Dr
- 753 Toni Dr
- 6400 Rogers Dr
- 2620 Brookridge Dr
- 2925 Ridgewood Dr
- 6350 Rogers Dr
- 9120 Nob Hill Dr
- 2244 Hurstview Dr
- 2221 Farrington Ln
- 6704 Nob Hill Ct
- 8920 Martin Dr
- 6708 Nob Hill Ct
- 2157 Lookout Ct
- 6448 Hawks Ridge Dr
- 6625 Crane Rd
- 2204 Mountainview Dr
- 203 W Greenbriar Ln
- 6432 Brynwyck Ln
- 704 Martin Rd
- 709 Springwood Dr
- 713 Springwood Dr
- 740 Martin Rd
- 700 Martin Rd
- 705 Springwood Dr
- 2701 Prestondale Dr
- 701 Springwood Dr
- 2705 Prestondale Dr
- 2701 Fox Glenn Ct
- 2705 Fox Glenn Ct
- 708 Springwood Dr
- 704 Springwood Dr
- 2709 Fox Glenn Ct
- 2709 Prestondale Dr
- 716 Springwood Dr
- 2657 Bent Tree Dr
- 700 Springwood Dr
- 2661 Bent Tree Dr
- 2713 Fox Glenn Ct
Your Personal Tour Guide
Ask me questions while you tour the home.