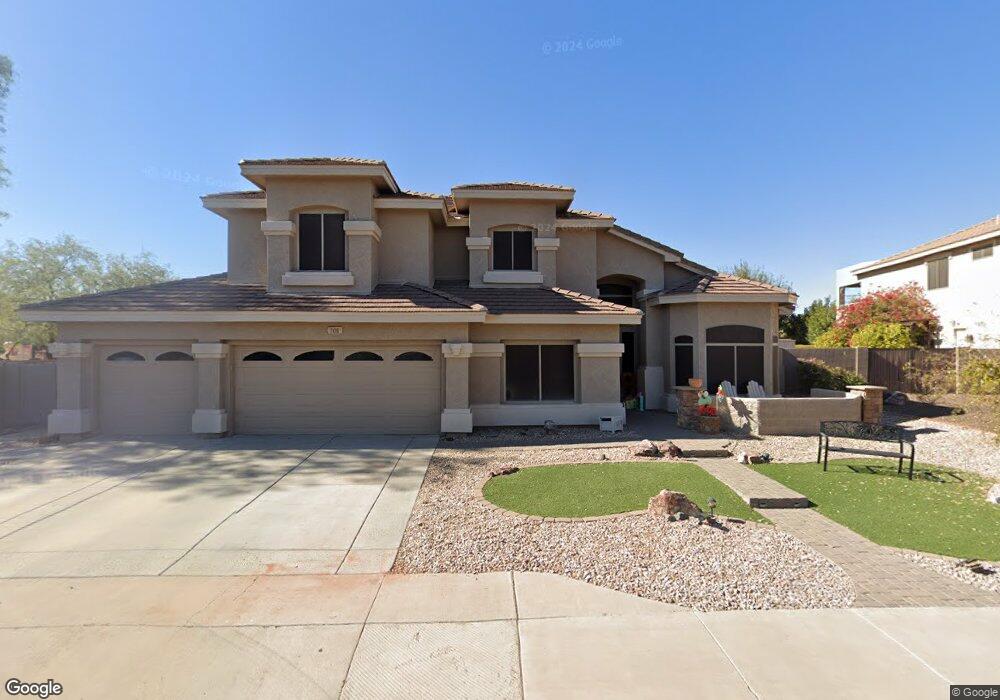
708 N 110th St Mesa, AZ 85207
Northeast Mesa NeighborhoodEstimated Value: $532,000 - $765,000
4
Beds
3
Baths
3,215
Sq Ft
$204/Sq Ft
Est. Value
About This Home
This home is located at 708 N 110th St, Mesa, AZ 85207 and is currently estimated at $655,629, approximately $203 per square foot. 708 N 110th St is a home located in Maricopa County with nearby schools including Sousa Elementary School, Franklin at Brimhall Elementary School, and Franklin West Elementary School.
Ownership History
Date
Name
Owned For
Owner Type
Purchase Details
Closed on
Jul 12, 2010
Sold by
Arioola Merle E
Bought by
Bailey Darin and Bailey Jena
Current Estimated Value
Home Financials for this Owner
Home Financials are based on the most recent Mortgage that was taken out on this home.
Original Mortgage
$235,330
Outstanding Balance
$156,614
Interest Rate
4.75%
Mortgage Type
FHA
Estimated Equity
$499,015
Purchase Details
Closed on
Jul 3, 2008
Sold by
Ariola Albert J and Ariola Merle E
Bought by
Ariola Merle E
Home Financials for this Owner
Home Financials are based on the most recent Mortgage that was taken out on this home.
Original Mortgage
$131,900
Interest Rate
6.31%
Mortgage Type
New Conventional
Purchase Details
Closed on
Jan 12, 2001
Sold by
First American Title Insurance Company
Bought by
Ariola Albert J and Ariola Merle E
Create a Home Valuation Report for This Property
The Home Valuation Report is an in-depth analysis detailing your home's value as well as a comparison with similar homes in the area
Home Values in the Area
Average Home Value in this Area
Purchase History
| Date | Buyer | Sale Price | Title Company |
|---|---|---|---|
| Bailey Darin | $238,500 | Chicago Title Insurance Co | |
| Ariola Merle E | -- | Lsi | |
| Ariola Albert J | $272,865 | First American Title |
Source: Public Records
Mortgage History
| Date | Status | Borrower | Loan Amount |
|---|---|---|---|
| Open | Bailey Darin | $235,330 | |
| Previous Owner | Ariola Merle E | $131,900 |
Source: Public Records
Tax History
| Year | Tax Paid | Tax Assessment Tax Assessment Total Assessment is a certain percentage of the fair market value that is determined by local assessors to be the total taxable value of land and additions on the property. | Land | Improvement |
|---|---|---|---|---|
| 2025 | $2,461 | $29,274 | -- | -- |
| 2024 | $2,487 | $27,880 | -- | -- |
| 2023 | $2,487 | $52,560 | $10,510 | $42,050 |
| 2022 | $2,434 | $38,270 | $7,650 | $30,620 |
| 2021 | $2,495 | $35,060 | $7,010 | $28,050 |
| 2020 | $2,462 | $33,800 | $6,760 | $27,040 |
| 2019 | $2,526 | $31,580 | $6,310 | $25,270 |
| 2018 | $2,388 | $30,620 | $6,120 | $24,500 |
| 2017 | $2,420 | $27,910 | $5,580 | $22,330 |
| 2016 | $2,198 | $29,170 | $5,830 | $23,340 |
| 2015 | $2,207 | $24,900 | $4,980 | $19,920 |
Source: Public Records
Map
Nearby Homes
- 813 N 110th St
- 11029 E Decatur St
- 820 N 111th St
- 833 N 110th St
- 11058 E Cholla Rd
- 538 N 110th St
- 535 N Bailey Cir
- 11248 E Dartmouth Cir
- 433 N 111th Place
- 10745 E Evergreen St
- 456 N Opal
- 11101 E University Dr Unit 108
- 11349 E Des Moines Cir
- 1105 N 110th St
- 345 N Signal Butte Rd Unit 23
- 11363 E Dartmouth St
- 10620 E Caballero St
- 1104 N Mountain Rd
- 11340 E Caballero St
- 11201 E Jupiter Dr
- 716 N 110th St
- 11009 E Dartmouth St
- 11008 E Dover St
- 11006 E Dartmouth St
- 11017 E Dartmouth St
- 11018 E Dover St
- 10959 E Dover St
- 10965 E Dover St
- 10951 E Dover St
- 11014 E Dartmouth St
- 11005 E Dover St
- 10926 E Dartmouth Cir
- 10943 E Dover St
- 11025 E Dartmouth St
- 11013 E Dover St
- 11026 E Dover St
- 11022 E Dartmouth St
- 10966 E Decatur St
- 11021 E Dover St
- 11006 E Decatur St
Your Personal Tour Guide
Ask me questions while you tour the home.