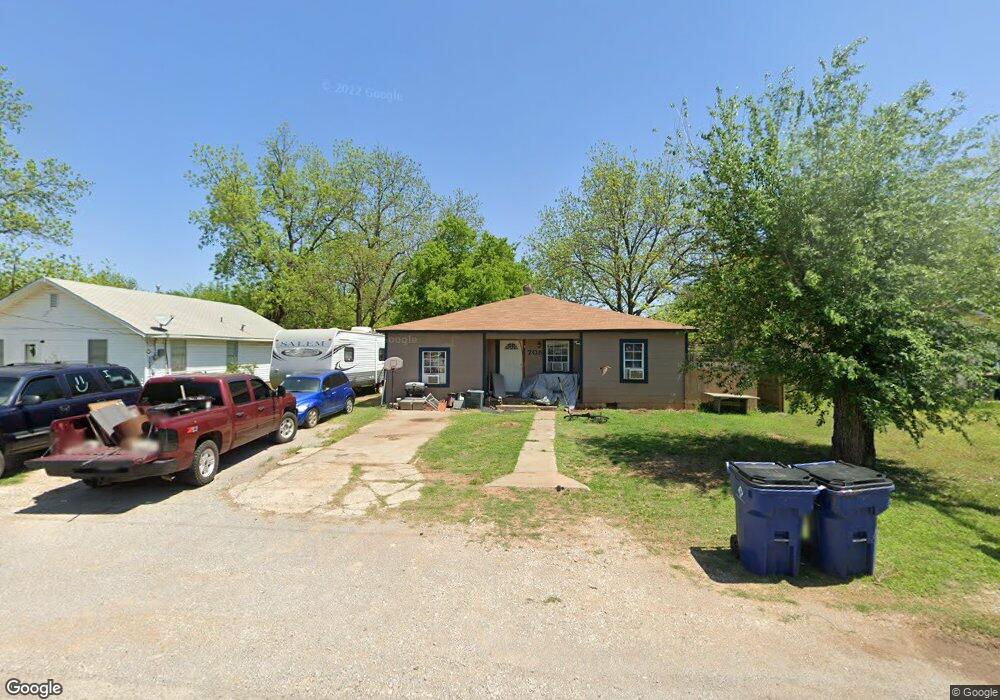
708 N 2nd St Duncan, OK 73533
Estimated Value: $48,000 - $96,000
3
Beds
1
Bath
1,606
Sq Ft
$49/Sq Ft
Est. Value
About This Home
This home is located at 708 N 2nd St, Duncan, OK 73533 and is currently estimated at $78,473, approximately $48 per square foot. 708 N 2nd St is a home located in Stephens County with nearby schools including Woodrow Wilson Elementary School, Duncan Middle School, and Duncan High School.
Ownership History
Date
Name
Owned For
Owner Type
Purchase Details
Closed on
Feb 12, 2014
Sold by
Henry Darrell
Bought by
Henry Della
Current Estimated Value
Purchase Details
Closed on
Mar 3, 2013
Sold by
Head Ella J
Bought by
Henry Samantha and Henry Darrell
Purchase Details
Closed on
Jan 10, 2012
Sold by
Mckenzie Dee Littleton and Littleton Dee
Bought by
Head Ella J and Ella J Head And Ella J Head Revocable Li
Purchase Details
Closed on
Sep 12, 1995
Sold by
Williams Jimmy W
Create a Home Valuation Report for This Property
The Home Valuation Report is an in-depth analysis detailing your home's value as well as a comparison with similar homes in the area
Home Values in the Area
Average Home Value in this Area
Purchase History
| Date | Buyer | Sale Price | Title Company |
|---|---|---|---|
| Henry Della | -- | None Available | |
| Henry Samantha | $9,000 | None Available | |
| Head Ella J | -- | None Available | |
| -- | $19,000 | -- |
Source: Public Records
Tax History Compared to Growth
Tax History
| Year | Tax Paid | Tax Assessment Tax Assessment Total Assessment is a certain percentage of the fair market value that is determined by local assessors to be the total taxable value of land and additions on the property. | Land | Improvement |
|---|---|---|---|---|
| 2025 | $387 | $4,590 | $219 | $4,371 |
| 2024 | $374 | $4,371 | $219 | $4,152 |
| 2023 | $374 | $4,370 | $371 | $3,999 |
| 2022 | $337 | $4,163 | $382 | $3,781 |
| 2021 | $237 | $2,793 | $175 | $2,618 |
| 2020 | $219 | $2,534 | $175 | $2,359 |
| 2019 | $216 | $2,496 | $175 | $2,321 |
| 2018 | $142 | $2,673 | $175 | $2,498 |
| 2017 | $131 | $2,596 | $352 | $2,244 |
| 2016 | $123 | $2,447 | $352 | $2,095 |
| 2015 | $313 | $2,447 | $352 | $2,095 |
| 2014 | $313 | $2,447 | $352 | $2,095 |
Source: Public Records
Map
Nearby Homes