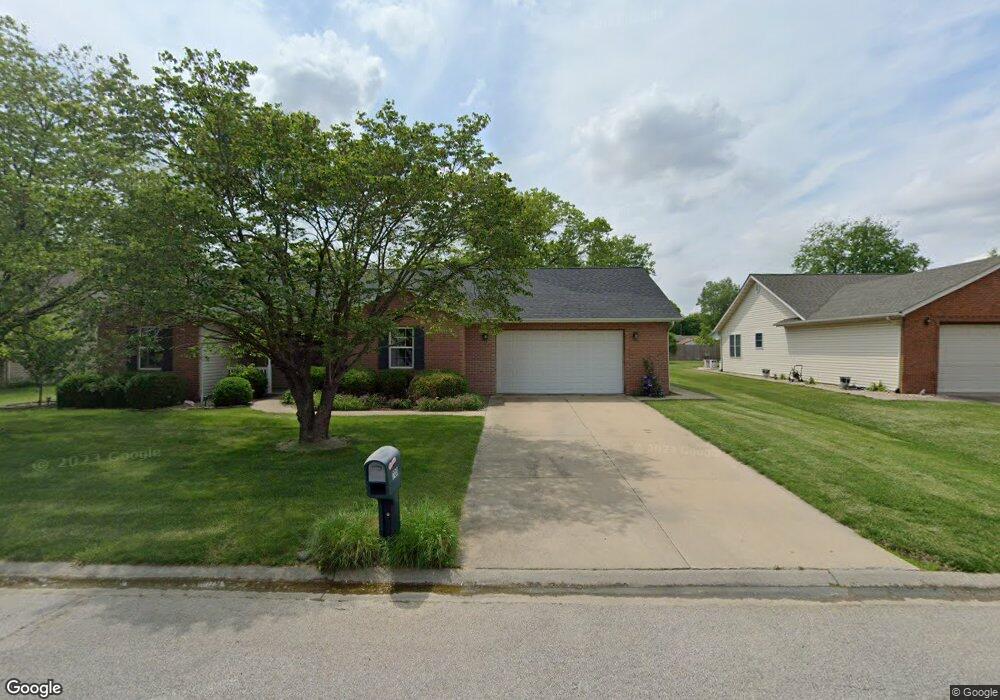
708 N Kristie Lynn St Freeburg, IL 62243
Estimated Value: $268,000 - $345,000
--
Bed
--
Bath
2,024
Sq Ft
$153/Sq Ft
Est. Value
About This Home
This home is located at 708 N Kristie Lynn St, Freeburg, IL 62243 and is currently estimated at $309,927, approximately $153 per square foot. 708 N Kristie Lynn St is a home located in St. Clair County with nearby schools including Freeburg Elementary School, Freeburg Community High School, and St. Joseph Catholic School.
Ownership History
Date
Name
Owned For
Owner Type
Purchase Details
Closed on
Oct 13, 2009
Sold by
Ivy Timothy W
Bought by
Ivy Susan E
Current Estimated Value
Purchase Details
Closed on
Jul 6, 2001
Sold by
Blomenkamp John S and Blomenkamp Patricia B
Bought by
Ivy Timothy W and Ivy Susan E
Home Financials for this Owner
Home Financials are based on the most recent Mortgage that was taken out on this home.
Original Mortgage
$120,000
Outstanding Balance
$46,547
Interest Rate
7.23%
Mortgage Type
Purchase Money Mortgage
Estimated Equity
$263,380
Purchase Details
Closed on
Apr 11, 2001
Sold by
Blomenkamp John S and Blomenkamp Patricia B
Bought by
Blomenkamp John S and Blomenkamp Patricia B
Home Financials for this Owner
Home Financials are based on the most recent Mortgage that was taken out on this home.
Original Mortgage
$128,000
Interest Rate
8.75%
Mortgage Type
Construction
Purchase Details
Closed on
Feb 26, 2001
Sold by
Sheppard William E and Sheppard Phyllis J
Bought by
Blomenkamp John S and Blomenkamp Patricia B
Home Financials for this Owner
Home Financials are based on the most recent Mortgage that was taken out on this home.
Original Mortgage
$128,000
Interest Rate
8.75%
Mortgage Type
Construction
Create a Home Valuation Report for This Property
The Home Valuation Report is an in-depth analysis detailing your home's value as well as a comparison with similar homes in the area
Home Values in the Area
Average Home Value in this Area
Purchase History
| Date | Buyer | Sale Price | Title Company |
|---|---|---|---|
| Ivy Susan E | -- | None Available | |
| Ivy Timothy W | $150,000 | Chicago Title | |
| Blomenkamp John S | -- | -- | |
| Blomenkamp John S | $23,000 | Chicago Title |
Source: Public Records
Mortgage History
| Date | Status | Borrower | Loan Amount |
|---|---|---|---|
| Open | Ivy Timothy W | $120,000 | |
| Previous Owner | Blomenkamp John S | $128,000 |
Source: Public Records
Tax History Compared to Growth
Tax History
| Year | Tax Paid | Tax Assessment Tax Assessment Total Assessment is a certain percentage of the fair market value that is determined by local assessors to be the total taxable value of land and additions on the property. | Land | Improvement |
|---|---|---|---|---|
| 2024 | $7,138 | $91,370 | $16,912 | $74,458 |
| 2023 | $6,970 | $88,187 | $16,323 | $71,864 |
| 2022 | $6,642 | $82,634 | $15,295 | $67,339 |
| 2021 | $6,403 | $77,795 | $14,399 | $63,396 |
| 2020 | $6,081 | $70,774 | $13,100 | $57,674 |
| 2019 | $6,179 | $74,818 | $13,540 | $61,278 |
| 2018 | $6,070 | $73,829 | $13,361 | $60,468 |
| 2017 | $2,930 | $70,589 | $12,774 | $57,815 |
| 2016 | $5,712 | $67,653 | $12,243 | $55,410 |
| 2014 | $2,486 | $66,713 | $12,563 | $54,150 |
| 2013 | $4,671 | $66,118 | $12,451 | $53,667 |
Source: Public Records
Map
Nearby Homes
- 3 Park St
- 0 Hickory Dr
- 103 Draco Dr
- 109 Willow Dr
- 111 Willow Dr
- 106 S Vine St
- 207 N Edison St
- 401 N Edison St
- 312 W Phillips St
- 206 N Main St
- 302 N Railroad St
- 520 N Edison St
- tbb Illinois 15
- 420 Foxtail Dr
- 440 Foxtail Dr
- 433 Foxtail Dr
- 304 Torrington Ln
- 359 Sleeping Indian Dr
- 363 Sleeping Indian Dr
- 222 Alamosa Dr
- 706 N Kristie Lynn St
- 710 N Kristie Lynn St
- 9 Park St
- 7 Park St
- 712 N Kristie Lynn St
- 704 N Kristie Lynn St
- 709 N Kristie Lynn St
- 5 Park St
- 707 N Kristie Lynn St
- 11 Park St
- 711 N Kristie Lynn St
- 705 N Kristie Lynn St
- 713 N Kristie Lynn St
- 702 N Kristie Lynn St
- 13 Park St
- 703 N Kristie Lynn St
- 708 Mary Ann Ct
- 715 N Kristie Lynn St
- 10 Park St