Estimated Value: $305,000 - $331,000
3
Beds
3
Baths
2,265
Sq Ft
$142/Sq Ft
Est. Value
About This Home
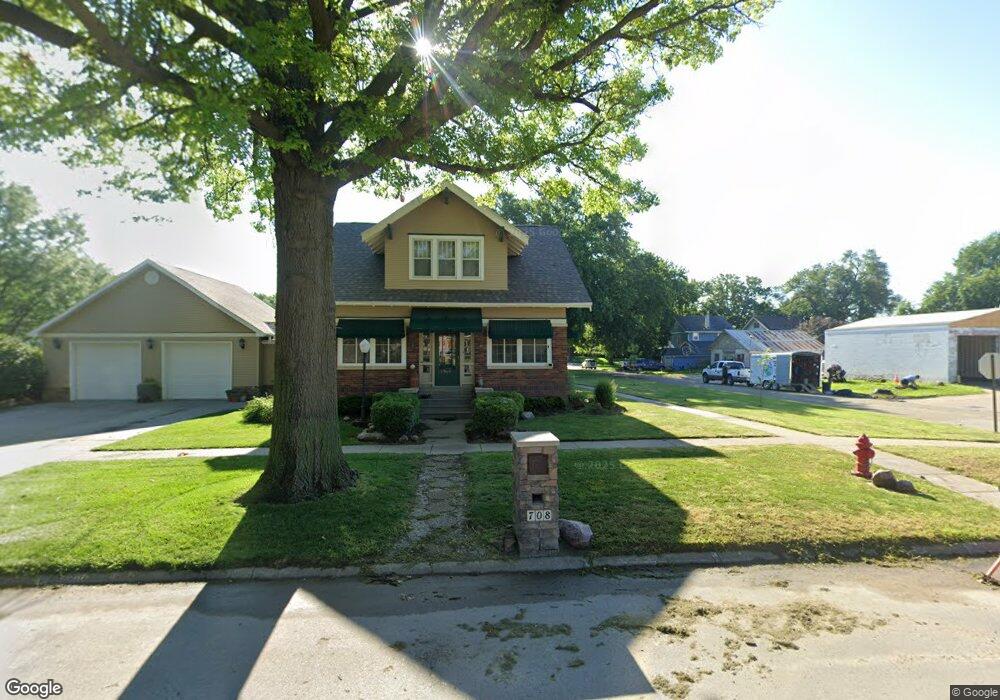
This home is located at 708 N Linden St, Wahoo, NE 68066 and is currently estimated at $320,720, approximately $141 per square foot. 708 N Linden St is a home located in Saunders County with nearby schools including Wahoo Elementary School, Wahoo Middle School, and Wahoo High School.
Ownership History
Date
Name
Owned For
Owner Type
Purchase Details
Closed on
Sep 2, 2014
Sold by
Cynthia K Cynthia K and Dawson Philip H
Bought by
Rodgers Cody and Rodgers Samantha
Current Estimated Value
Purchase Details
Closed on
Feb 17, 2011
Sold by
Hohl Cynthia K
Bought by
Hohl Cynthia K and Dawson Philip H
Purchase Details
Closed on
Jan 25, 2011
Sold by
Hohl Cynthia K
Bought by
Hohl Cynthia K and Dawson Philip H
Create a Home Valuation Report for This Property
The Home Valuation Report is an in-depth analysis detailing your home's value as well as a comparison with similar homes in the area
Home Values in the Area
Average Home Value in this Area
Purchase History
| Date | Buyer | Sale Price | Title Company |
|---|---|---|---|
| Rodgers Cody | -- | Title Services Of The Plains | |
| Hohl Cynthia K | -- | -- | |
| Hohl Cynthia K | -- | -- |
Source: Public Records
Mortgage History
| Date | Status | Borrower | Loan Amount |
|---|---|---|---|
| Open | Hohl Cynthia K | $135,000 | |
| Previous Owner | Hohl Cynthia K | $139,200 | |
| Previous Owner | Hohl Cynthia K | $34,000 |
Source: Public Records
Tax History Compared to Growth
Tax History
| Year | Tax Paid | Tax Assessment Tax Assessment Total Assessment is a certain percentage of the fair market value that is determined by local assessors to be the total taxable value of land and additions on the property. | Land | Improvement |
|---|---|---|---|---|
| 2024 | $3,346 | $246,610 | $34,482 | $212,128 |
| 2023 | $4,114 | $235,054 | $34,482 | $200,572 |
| 2022 | $3,882 | $206,991 | $34,482 | $172,509 |
| 2021 | $3,551 | $184,183 | $34,482 | $149,701 |
| 2020 | $3,480 | $179,309 | $34,482 | $144,827 |
| 2019 | $3,448 | $173,738 | $34,482 | $139,256 |
| 2018 | $3,460 | $166,960 | $34,480 | $132,480 |
| 2017 | $3,450 | $166,960 | $34,480 | $132,480 |
| 2016 | $3,732 | $177,960 | $31,300 | $146,660 |
| 2015 | $3,759 | $177,960 | $31,300 | $146,660 |
| 2014 | $3,825 | $177,960 | $31,300 | $146,660 |
| 2012 | $3,720 | $163,500 | $16,840 | $146,660 |
Source: Public Records
Map
Nearby Homes