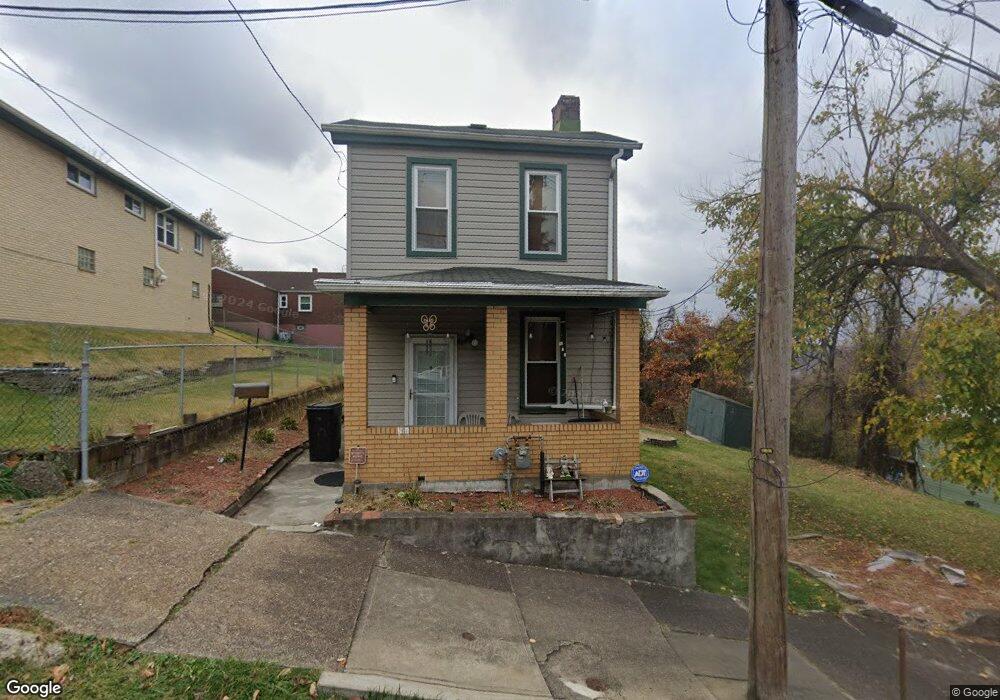
708 N Main St Braddock, PA 15104
North Braddock NeighborhoodEstimated Value: $41,000 - $149,000
2
Beds
1
Bath
1,445
Sq Ft
$59/Sq Ft
Est. Value
About This Home
This home is located at 708 N Main St, Braddock, PA 15104 and is currently estimated at $85,398, approximately $59 per square foot. 708 N Main St is a home located in Allegheny County with nearby schools including Woodland Hills Senior High School, Braddock Hills High School, and Christ Lutheran School.
Ownership History
Date
Name
Owned For
Owner Type
Purchase Details
Closed on
Jun 13, 2012
Sold by
Home Solutions Prtnrs Iii Reo
Bought by
Transportation Alliance Bank I
Current Estimated Value
Purchase Details
Closed on
Feb 19, 2010
Sold by
R E C A L P
Bought by
Home Solutions Partners Iii R
Purchase Details
Closed on
Jun 5, 2003
Sold by
Blasko James P and Blasko Amy J
Bought by
National City Bank
Purchase Details
Closed on
Jun 11, 1998
Sold by
Blasko James
Bought by
Blasko James and Blasko Amy J
Purchase Details
Closed on
Nov 30, 1995
Sold by
Zawodini Jamie M
Bought by
Blasko James
Purchase Details
Closed on
Jul 6, 1995
Sold by
Wawrocki Stanley and Novan Mary D
Bought by
Zawodini Jamie M
Create a Home Valuation Report for This Property
The Home Valuation Report is an in-depth analysis detailing your home's value as well as a comparison with similar homes in the area
Home Values in the Area
Average Home Value in this Area
Purchase History
| Date | Buyer | Sale Price | Title Company |
|---|---|---|---|
| Transportation Alliance Bank I | $11,173 | -- | |
| Home Solutions Partners Iii R | $6,591 | -- | |
| National City Bank | $1,257 | -- | |
| Blasko James | -- | -- | |
| Blasko James | -- | -- | |
| Zawodini Jamie M | $15,900 | -- |
Source: Public Records
Tax History
| Year | Tax Paid | Tax Assessment Tax Assessment Total Assessment is a certain percentage of the fair market value that is determined by local assessors to be the total taxable value of land and additions on the property. | Land | Improvement |
|---|---|---|---|---|
| 2025 | $1,440 | $34,100 | $3,000 | $31,100 |
| 2024 | $1,440 | $34,100 | $3,000 | $31,100 |
| 2023 | $1,457 | $34,100 | $3,000 | $31,100 |
| 2022 | $1,457 | $34,100 | $3,000 | $31,100 |
| 2021 | $161 | $34,100 | $3,000 | $31,100 |
| 2020 | $1,427 | $34,100 | $3,000 | $31,100 |
| 2019 | $1,401 | $34,100 | $3,000 | $31,100 |
| 2017 | $1,401 | $34,100 | $3,000 | $31,100 |
Source: Public Records
Map
Nearby Homes
Your Personal Tour Guide
Ask me questions while you tour the home.