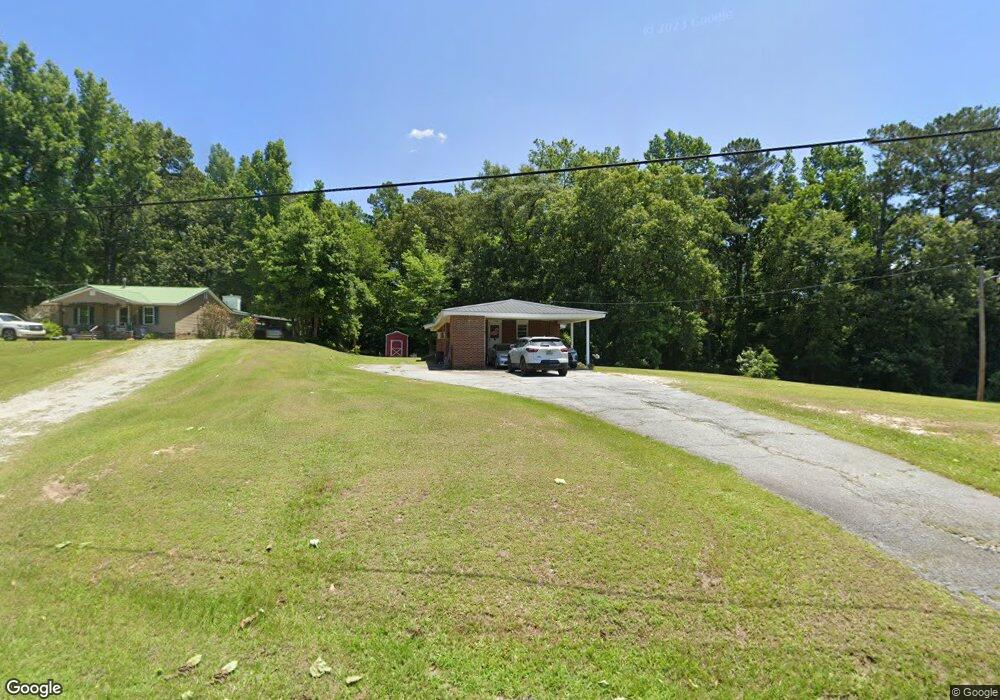
708 N Usry St Gibson, GA 30810
Estimated Value: $118,000 - $152,527
3
Beds
2
Baths
1,375
Sq Ft
$98/Sq Ft
Est. Value
About This Home
This home is located at 708 N Usry St, Gibson, GA 30810 and is currently estimated at $135,264, approximately $98 per square foot. 708 N Usry St is a home located in Glascock County with nearby schools including Glascock County Consolidated School.
Ownership History
Date
Name
Owned For
Owner Type
Purchase Details
Closed on
Sep 9, 2022
Sold by
Kelley Renae
Bought by
Chalker Katherine E
Current Estimated Value
Create a Home Valuation Report for This Property
The Home Valuation Report is an in-depth analysis detailing your home's value as well as a comparison with similar homes in the area
Home Values in the Area
Average Home Value in this Area
Purchase History
| Date | Buyer | Sale Price | Title Company |
|---|---|---|---|
| Chalker Katherine E | -- | -- |
Source: Public Records
Tax History Compared to Growth
Tax History
| Year | Tax Paid | Tax Assessment Tax Assessment Total Assessment is a certain percentage of the fair market value that is determined by local assessors to be the total taxable value of land and additions on the property. | Land | Improvement |
|---|---|---|---|---|
| 2024 | $1,338 | $47,090 | $5,645 | $41,445 |
| 2023 | $1,121 | $41,454 | $5,645 | $35,810 |
| 2022 | $1,334 | $49,012 | $11,546 | $37,466 |
| 2021 | $1,125 | $37,965 | $11,546 | $26,419 |
| 2020 | $1,087 | $37,965 | $11,546 | $26,419 |
| 2019 | $1,199 | $37,965 | $11,546 | $26,419 |
| 2018 | $1,199 | $37,965 | $11,546 | $26,419 |
| 2017 | $1,087 | $37,965 | $11,546 | $26,419 |
| 2016 | $1,087 | $37,965 | $11,546 | $26,419 |
| 2015 | -- | $37,964 | $11,546 | $26,419 |
| 2014 | -- | $37,964 | $11,546 | $26,419 |
| 2013 | -- | $38,270 | $11,545 | $26,725 |
Source: Public Records
Map
Nearby Homes
- 99 W Main St
- 0 Lamp Rd Unit 547551
- 53.36 ACRES Irby & Bastonville Rd
- 29.61 Irby Rd
- 2582 Georgia 171
- 0 Lampp Rd
- 0 Bastonville Rd Unit (Tract 14)
- 0 Bastonville Rd Unit 10627311
- 3479 Bastonville Rd
- Edford Reese Rd
- Edford Reese Rd
- Edford Reese Rd
- Edford Reese Rd
- Edford Reese Rd
- Edford Reese Rd
- 1171 Main St
- 8747 Williams Bridge Rd
- 5559 Mill Creek Church Rd
- 0 Edgehill Mitchell Rd
- 3275 Hadden Pond Rd