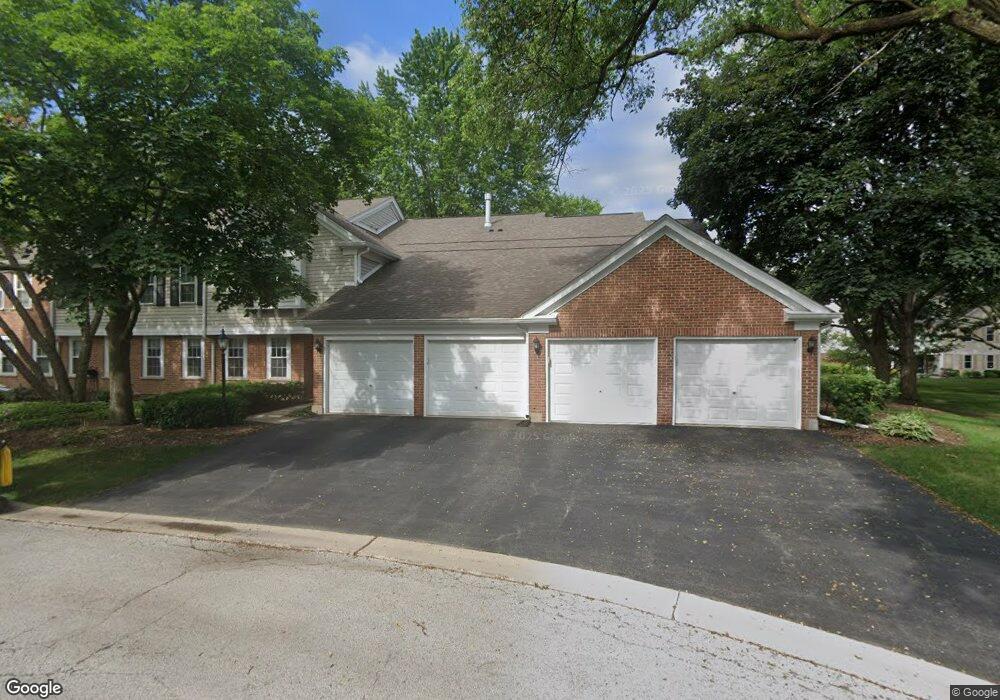
708 Newgate Ln Unit 124103 Prospect Heights, IL 60070
Estimated Value: $298,777 - $350,000
2
Beds
--
Bath
1,246
Sq Ft
$267/Sq Ft
Est. Value
About This Home
This home is located at 708 Newgate Ln Unit 124103, Prospect Heights, IL 60070 and is currently estimated at $333,194, approximately $267 per square foot. 708 Newgate Ln Unit 124103 is a home located in Cook County with nearby schools including Euclid Elementary School, River Trails Middle School, and John Hersey High School.
Ownership History
Date
Name
Owned For
Owner Type
Purchase Details
Closed on
Jul 31, 1998
Sold by
Kracik Deborah Kashul and Kashul Deborah A
Bought by
Lesniewski Vladimir K
Current Estimated Value
Home Financials for this Owner
Home Financials are based on the most recent Mortgage that was taken out on this home.
Original Mortgage
$100,001
Interest Rate
7.07%
Purchase Details
Closed on
Nov 29, 1994
Sold by
Holley Lavelle A and Holley Rosemary
Bought by
Kashul Deborah A
Home Financials for this Owner
Home Financials are based on the most recent Mortgage that was taken out on this home.
Original Mortgage
$127,800
Interest Rate
8.91%
Purchase Details
Closed on
Aug 23, 1993
Sold by
Holley Lavelle A and Holley Rosemary
Bought by
Holley Lavelle A and Holley Rosemary
Create a Home Valuation Report for This Property
The Home Valuation Report is an in-depth analysis detailing your home's value as well as a comparison with similar homes in the area
Home Values in the Area
Average Home Value in this Area
Purchase History
| Date | Buyer | Sale Price | Title Company |
|---|---|---|---|
| Lesniewski Vladimir K | $157,500 | Chicago Title Insurance Co | |
| Kashul Deborah A | $142,000 | -- | |
| Holley Lavelle A | -- | -- |
Source: Public Records
Mortgage History
| Date | Status | Borrower | Loan Amount |
|---|---|---|---|
| Closed | Lesniewski Vladimir K | $100,001 | |
| Previous Owner | Kashul Deborah A | $127,800 |
Source: Public Records
Tax History Compared to Growth
Tax History
| Year | Tax Paid | Tax Assessment Tax Assessment Total Assessment is a certain percentage of the fair market value that is determined by local assessors to be the total taxable value of land and additions on the property. | Land | Improvement |
|---|---|---|---|---|
| 2024 | $2,673 | $19,910 | $1,793 | $18,117 |
| 2023 | $2,587 | $19,910 | $1,793 | $18,117 |
| 2022 | $2,587 | $19,910 | $1,793 | $18,117 |
| 2021 | $2,904 | $16,476 | $560 | $15,916 |
| 2020 | $2,598 | $16,476 | $560 | $15,916 |
| 2019 | $2,576 | $18,457 | $560 | $17,897 |
| 2018 | $2,812 | $15,433 | $448 | $14,985 |
| 2017 | $2,762 | $15,433 | $448 | $14,985 |
| 2016 | $3,370 | $15,433 | $448 | $14,985 |
| 2015 | $2,943 | $13,454 | $896 | $12,558 |
| 2014 | $2,940 | $13,454 | $896 | $12,558 |
| 2013 | $2,837 | $13,454 | $896 | $12,558 |
Source: Public Records
Map
Nearby Homes
- 688 Glasgow Ln Unit 121133
- 212 Country Club Dr Unit 198
- 763 Sussex Corner Ln Unit 15
- 603 Thistle Ln Unit 16185
- 501 Aberdeen Ln Unit C
- 354 Country Club Dr
- 302 Lonsdale Rd
- 1214 N Crabtree Ln
- 203 Coldren Dr
- 1121 N Greenfield Ln
- 1116 N Westgate Rd
- 703 Newcastle Ln
- 206 E Camp Mcdonald Rd
- 1205 E Camp Mcdonald Rd
- 1000 N Westgate Rd
- 1008 N Newberry Ln
- 300 E Marion Ave
- 1142 N Boxwood Dr Unit B
- 1120 N Boxwood Dr Unit B
- 1622 E Greenwood Dr
- 708 Newgate Ln Unit 124103
- 708 Newgate Ln Unit 124103
- 708 Newgate Ln Unit 124103
- 708 Newgate Ln Unit C
- 708 Newgate Ln Unit D
- 700 Newgate Ln Unit D
- 700 Newgate Ln Unit 124103
- 700 Newgate Ln Unit 124103
- 700 Newgate Ln Unit 124103
- 700 Newgate Ln Unit 124103
- 700 Newgate Ln Unit A
- 700 Newgate Ln Unit B
- 665 Pembridge Ln Unit 125106
- 665 Pembridge Ln Unit 125106
- 665 Pembridge Ln Unit 125106
- 665 Pembridge Ln Unit 125106
- 665 Pembridge Ln Unit B
- 665 Pembridge Ln Unit A
- 657 Pembridge Ln Unit 125106
- 657 Pembridge Ln Unit 125106