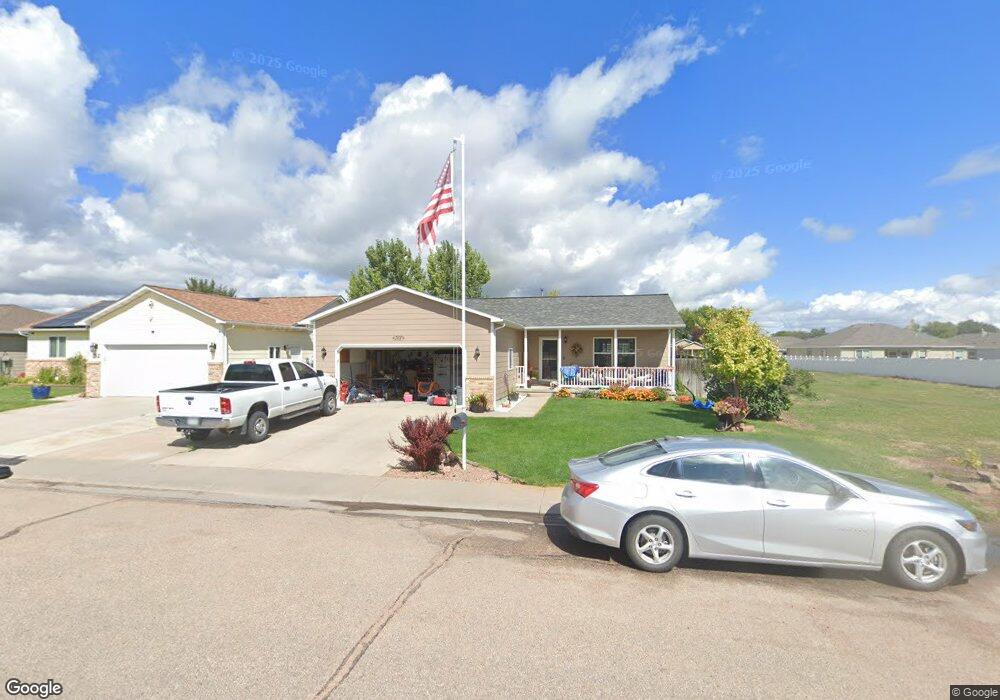
708 Nicole Rd Sterling, CO 80751
Estimated Value: $311,000 - $399,000
4
Beds
3
Baths
1,960
Sq Ft
$183/Sq Ft
Est. Value
About This Home
This home is located at 708 Nicole Rd, Sterling, CO 80751 and is currently estimated at $358,830, approximately $183 per square foot. 708 Nicole Rd is a home located in Logan County with nearby schools including Ayres Elementary School, Campbell Elementary School, and Sterling Middle School.
Ownership History
Date
Name
Owned For
Owner Type
Purchase Details
Closed on
Jan 12, 2022
Sold by
Gillham Richard Dean
Bought by
Gillham Nita Jo
Current Estimated Value
Purchase Details
Closed on
Sep 20, 2018
Sold by
Roberts Christopher R and Roberts Ashley L
Bought by
Kruger Eli W and Kruger Amanda K
Home Financials for this Owner
Home Financials are based on the most recent Mortgage that was taken out on this home.
Original Mortgage
$215,151
Interest Rate
4.5%
Mortgage Type
New Conventional
Purchase Details
Closed on
Apr 27, 2012
Sold by
Holman Scott and Holman Amy J
Bought by
Roberts Christopher R and Roberts Ashley L
Home Financials for this Owner
Home Financials are based on the most recent Mortgage that was taken out on this home.
Original Mortgage
$163,163
Interest Rate
3.97%
Mortgage Type
New Conventional
Create a Home Valuation Report for This Property
The Home Valuation Report is an in-depth analysis detailing your home's value as well as a comparison with similar homes in the area
Home Values in the Area
Average Home Value in this Area
Purchase History
| Date | Buyer | Sale Price | Title Company |
|---|---|---|---|
| Gillham Nita Jo | -- | None Listed On Document | |
| Gillham Nita Jo | -- | None Listed On Document | |
| Kruger Eli W | $213,000 | Stewart Title | |
| Roberts Christopher R | $159,900 | None Available |
Source: Public Records
Mortgage History
| Date | Status | Borrower | Loan Amount |
|---|---|---|---|
| Previous Owner | Kruger Eli W | $215,151 | |
| Previous Owner | Roberts Christopher R | $163,163 |
Source: Public Records
Tax History Compared to Growth
Tax History
| Year | Tax Paid | Tax Assessment Tax Assessment Total Assessment is a certain percentage of the fair market value that is determined by local assessors to be the total taxable value of land and additions on the property. | Land | Improvement |
|---|---|---|---|---|
| 2024 | $1,397 | $22,010 | $0 | $0 |
| 2023 | $1,397 | $22,010 | $0 | $0 |
| 2022 | $1,460 | $17,330 | $1,740 | $15,590 |
| 2021 | $1,427 | $17,820 | $1,790 | $16,030 |
| 2020 | $1,266 | $30,060 | $1,750 | $28,310 |
| 2019 | $1,271 | $30,060 | $1,750 | $28,310 |
| 2018 | $1,167 | $13,780 | $1,580 | $12,200 |
| 2017 | $1,148 | $67,000 | $7,700 | $59,300 |
| 2015 | $1,165 | $62,820 | $10,500 | $52,320 |
| 2014 | $1,165 | $59,070 | $9,100 | $49,970 |
| 2013 | $1,165 | $59,070 | $9,100 | $49,970 |
Source: Public Records
Map
Nearby Homes
- 804 Nicole Rd
- 817 Mindy Cir Unit A
- 1815 Robin Rd
- 603 W Lark Ln
- 1803 Robin Rd
- 1704 Robin Rd
- 507 Jonquil Rd
- 427 Jonquil St
- 19140 Chambers Dr
- 1417 S 9th Ave
- 1410 S 8th Ave
- 1422 S 5th Ave
- 1409 S 6th Ave
- 819 Glenora St
- 805 Fairhurst St
- 920 Glenora St
- 909 Fairhurst St
- 1325 S 4th Ave
- 1130 S 9th Ave Unit 103
- 521 Delmar St
- 0 Mindy Ct
- 712 Nicole Rd
- 0 Nicole Rd Unit 508766
- 0 Nicole Rd Unit 508762
- 0 Nicole Rd Unit 508533
- 0 Nicole Rd Unit 508526
- 0 Nicole Rd Unit 602236
- 716 Nicole Rd
- 709 Nicole Rd
- 707 Mindy Ct
- 711 Mindy Ct
- 715 Nicole Rd
- 717 Nicole Rd
- 717 Mindy Ct
- 722 Nicole Rd
- 629 Mindy Ct
- 723 Nicole Rd
- 625 Mindy Ct
- 626 Oleander Way
- 706 Mindy Ct