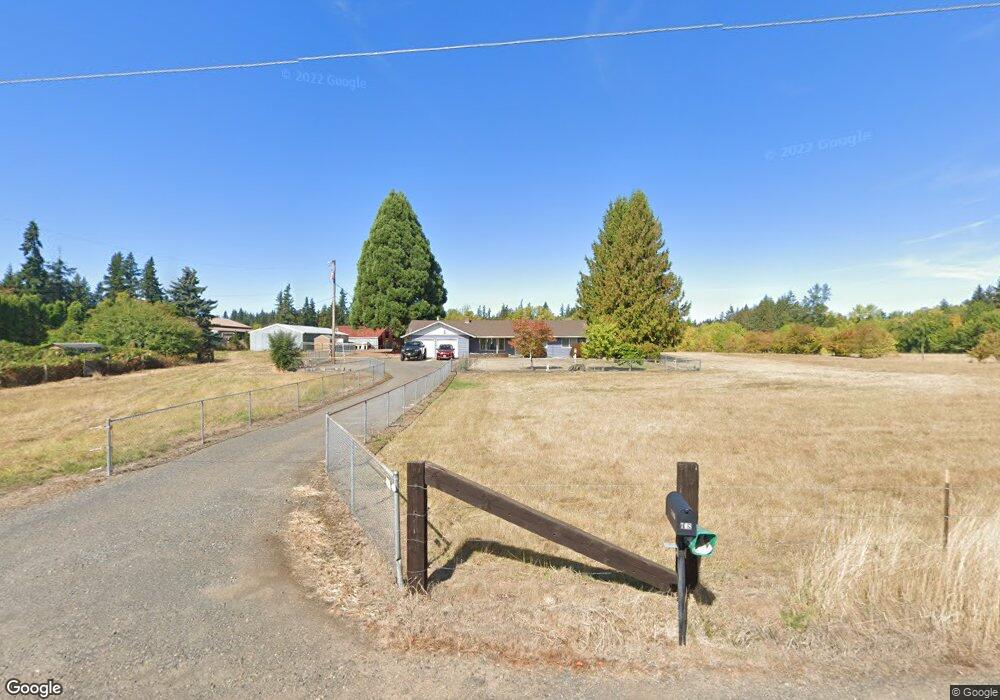
708 NW 194th St Ridgefield, WA 98642
Estimated Value: $612,000 - $855,000
3
Beds
2
Baths
1,429
Sq Ft
$494/Sq Ft
Est. Value
About This Home
This home is located at 708 NW 194th St, Ridgefield, WA 98642 and is currently estimated at $705,565, approximately $493 per square foot. 708 NW 194th St is a home located in Clark County with nearby schools including Ridgefield High School, The Gardner School of Arts & Sciences, and Cedar Tree Classical Christian School.
Ownership History
Date
Name
Owned For
Owner Type
Purchase Details
Closed on
Jul 29, 2025
Sold by
Revocable Living Trust Of Cynthia Kay Mc and Mcandrew James Lester
Bought by
Mcandrew James Lester
Current Estimated Value
Purchase Details
Closed on
Oct 9, 2024
Sold by
Mcandrew Cindy Kay and Mcandrew Cynthia Kay
Bought by
Revocable Living Trust Of Cynthia Kay Mcandre and Mcandrew
Purchase Details
Closed on
Sep 11, 2024
Sold by
Ruby Randolph Randy Clay
Bought by
Mcandrew Cynthia Cindy and Mcandrew Cynthia Kay
Purchase Details
Closed on
Oct 31, 2006
Sold by
Ruby Carol
Bought by
Ruby Randy C
Home Financials for this Owner
Home Financials are based on the most recent Mortgage that was taken out on this home.
Original Mortgage
$125,000
Interest Rate
6.3%
Mortgage Type
Purchase Money Mortgage
Purchase Details
Closed on
Jul 19, 2001
Sold by
Ruby Randolph C and Mcandrew Cynthia K
Bought by
Ruby Randolph C and Mcandrew Cynthia K
Create a Home Valuation Report for This Property
The Home Valuation Report is an in-depth analysis detailing your home's value as well as a comparison with similar homes in the area
Home Values in the Area
Average Home Value in this Area
Purchase History
| Date | Buyer | Sale Price | Title Company |
|---|---|---|---|
| Mcandrew James Lester | $313 | None Listed On Document | |
| Revocable Living Trust Of Cynthia Kay Mcandre | $313 | None Listed On Document | |
| Mcandrew Cynthia Cindy | -- | None Listed On Document | |
| Ruby Randy C | -- | Chicago Title | |
| Ruby Randolph C | -- | -- |
Source: Public Records
Mortgage History
| Date | Status | Borrower | Loan Amount |
|---|---|---|---|
| Previous Owner | Ruby Randy C | $125,000 |
Source: Public Records
Tax History Compared to Growth
Tax History
| Year | Tax Paid | Tax Assessment Tax Assessment Total Assessment is a certain percentage of the fair market value that is determined by local assessors to be the total taxable value of land and additions on the property. | Land | Improvement |
|---|---|---|---|---|
| 2025 | $5,849 | $624,258 | $367,419 | $256,839 |
| 2024 | $5,427 | $623,017 | $367,419 | $255,598 |
| 2023 | $5,307 | $616,026 | $360,803 | $255,223 |
| 2022 | $4,772 | $578,140 | $350,889 | $227,251 |
| 2021 | $4,602 | $484,661 | $291,999 | $192,662 |
| 2020 | $4,550 | $436,835 | $264,357 | $172,478 |
| 2019 | $4,227 | $425,454 | $253,540 | $171,914 |
| 2018 | $4,599 | $399,280 | $0 | $0 |
| 2017 | $3,556 | $376,047 | $0 | $0 |
| 2016 | $3,315 | $339,192 | $0 | $0 |
| 2015 | $2,979 | $301,995 | $0 | $0 |
| 2014 | -- | $258,803 | $0 | $0 |
| 2013 | -- | $235,456 | $0 | $0 |
Source: Public Records
Map
Nearby Homes
- 19306 NW 11th Ave
- 19818 NW 14th Ave
- 701 NW 184th St
- 0 NW 184th St
- 702 NW 178th Way
- 846 NW 178th Way
- 850 NW 178th Way
- 904 NW 178th Way
- 908 NW 178th Way
- 912 NW 178th Way
- 916 NW 178th Way
- Wintergreen Plan at Haven Northwest - Seasons at North Haven
- Marblewood Plan at Haven Northwest - Seasons at North Haven
- Alpine Plan at Haven Northwest - Seasons at North Haven
- Ironwood 1 Plan at Haven Northwest - Seasons at North Haven
- Ironwood 2 Plan at Haven Northwest - Seasons at North Haven
- Ironwood Plan at Haven Northwest - Seasons at North Haven
- 1911 NW 206th St
- 0 NE 10th Ave Unit 308311465
- 0 NE 10th Ave Unit 781835902
- 802 NW 194th St
- 0 NW 194th St
- 707 NW 194th St
- 604 NW 194th St
- 19511 NW 9th Ct
- 19517 NW 9th Ct
- 515 NW 194th St
- 916 NW 194th St
- 506 NW 194th St
- 19611 NW 9th Ct
- 901 NW 194th St
- 619 NW 199th St
- 0 NW 9th Ct #115-1 Unit 628076
- 0 NW 9th Ct #115-1 Unit 627311
- 1002 NW 194th St
- 603 NW 199th St
- 408 NW 194th St
- 411 NW 194th St
- 919 NW 194th St
- 19419 NW 11th Ave