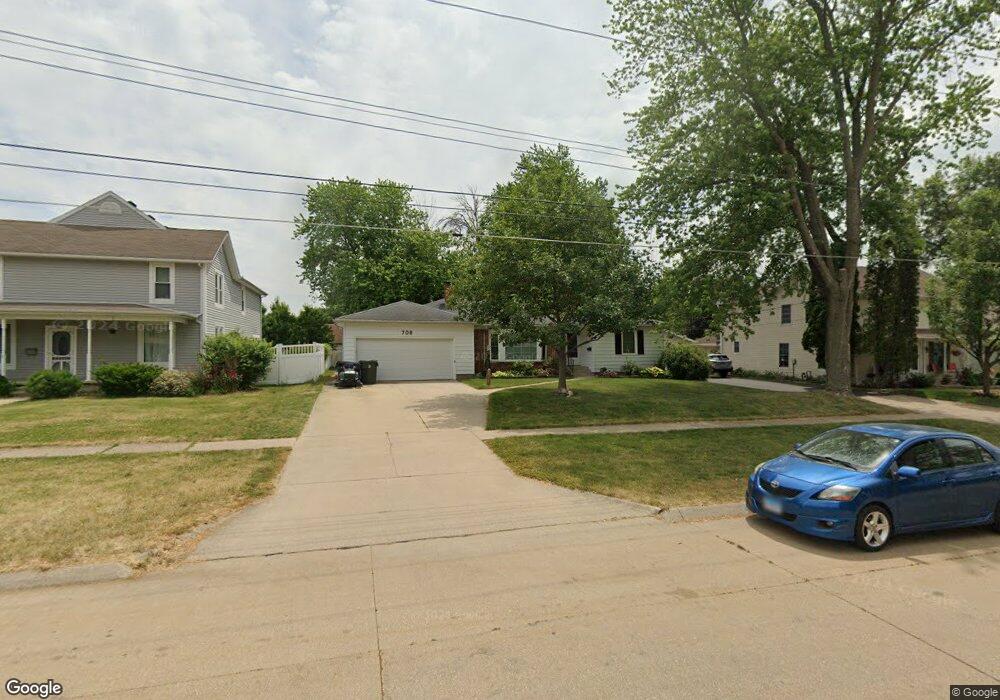
708 S Center St Geneseo, IL 61254
Estimated Value: $175,000 - $230,000
2
Beds
--
Bath
1,625
Sq Ft
$124/Sq Ft
Est. Value
About This Home
This home is located at 708 S Center St, Geneseo, IL 61254 and is currently estimated at $201,694, approximately $124 per square foot. 708 S Center St is a home located in Henry County with nearby schools including Geneseo High School and St. Malachy School.
Ownership History
Date
Name
Owned For
Owner Type
Purchase Details
Closed on
Jul 14, 2008
Sold by
Johnson Karen E
Bought by
Huddleston Nathanial B and Huddleston Deanna L
Current Estimated Value
Home Financials for this Owner
Home Financials are based on the most recent Mortgage that was taken out on this home.
Original Mortgage
$110,000
Outstanding Balance
$72,495
Interest Rate
6.5%
Mortgage Type
New Conventional
Estimated Equity
$129,199
Purchase Details
Closed on
Jun 28, 2007
Sold by
Pischke Mark L and Pischke Melissa M
Bought by
Johnson Karen E
Home Financials for this Owner
Home Financials are based on the most recent Mortgage that was taken out on this home.
Original Mortgage
$140,000
Interest Rate
6.26%
Mortgage Type
New Conventional
Create a Home Valuation Report for This Property
The Home Valuation Report is an in-depth analysis detailing your home's value as well as a comparison with similar homes in the area
Home Values in the Area
Average Home Value in this Area
Purchase History
| Date | Buyer | Sale Price | Title Company |
|---|---|---|---|
| Huddleston Nathanial B | $140,000 | None Available | |
| Johnson Karen E | $168,500 | None Available |
Source: Public Records
Mortgage History
| Date | Status | Borrower | Loan Amount |
|---|---|---|---|
| Open | Huddleston Nathanial B | $110,000 | |
| Previous Owner | Johnson Karen E | $140,000 |
Source: Public Records
Tax History Compared to Growth
Tax History
| Year | Tax Paid | Tax Assessment Tax Assessment Total Assessment is a certain percentage of the fair market value that is determined by local assessors to be the total taxable value of land and additions on the property. | Land | Improvement |
|---|---|---|---|---|
| 2024 | $5,223 | $70,263 | $6,173 | $64,090 |
| 2023 | $4,600 | $63,992 | $5,622 | $58,370 |
| 2022 | $4,346 | $59,472 | $5,225 | $54,247 |
| 2021 | $4,245 | $57,965 | $5,093 | $52,872 |
| 2020 | $4,229 | $58,503 | $5,140 | $53,363 |
| 2019 | $4,092 | $57,852 | $5,083 | $52,769 |
| 2018 | $3,856 | $54,680 | $4,804 | $49,876 |
| 2017 | $3,614 | $53,294 | $4,682 | $48,612 |
| 2016 | $4,133 | $56,517 | $4,563 | $51,954 |
| 2015 | $3,807 | $56,404 | $4,554 | $51,850 |
| 2013 | $3,807 | $55,348 | $4,469 | $50,879 |
Source: Public Records
Map
Nearby Homes
- 608 S Oakwood Ave
- 228 E Locust St
- 317 E South St
- 909 S Spring St
- 335 S Stewart St
- 513 E Pearl St
- 321 Pin Oak Dr
- 101 S Stewart St
- 127 N Vail St
- 624 E Chestnut St
- 139 N Vail St
- 227 N State St
- 417 E Orange St
- 326 N Vail St
- 19025 Bluff Rd
- 549 E Park St
- 629 W Wells St
- 623 E Park St
- 522 N State St
- 407 N Chicago St
- 702 S Center St
- 712 S Center St
- 718 S Center St
- 626 S Center St
- 724 S Center St
- 711 S Center St
- 622 S Center St
- 703 S State St
- 701 S Center St
- 709 S State St
- 635 S State St
- 728 S Center St
- 629 S State St
- 625 S Center St
- 618 S Center St
- 721 S State St
- 705 S Center St
- 727 S Center St
- 715 S State St
- 721 S Center St