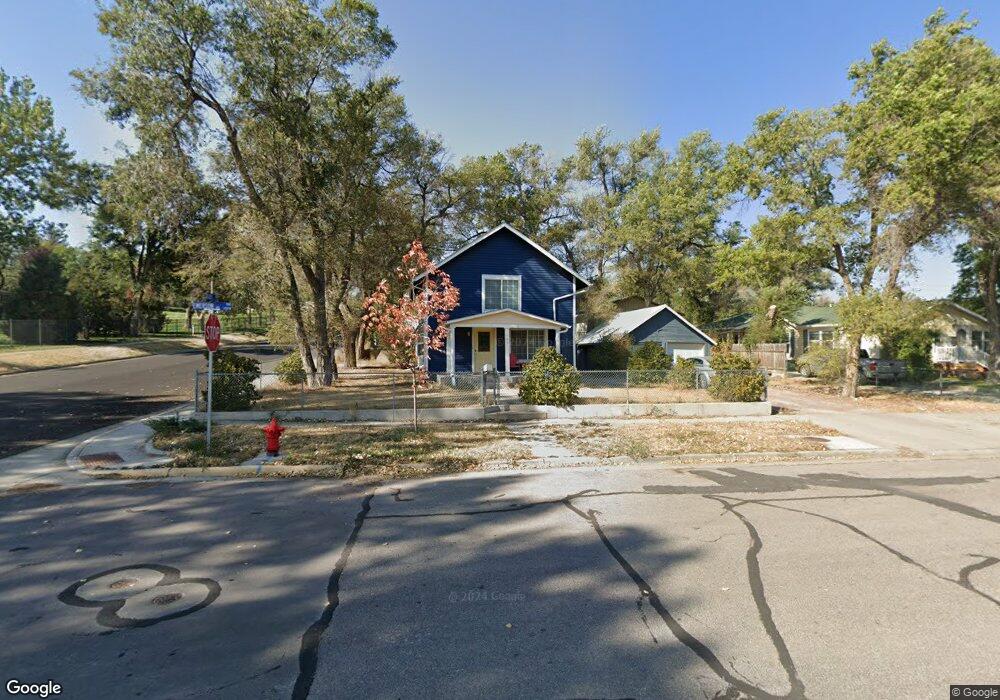
708 S Emerson Ave Gillette, WY 82716
Estimated Value: $252,000 - $271,000
4
Beds
2
Baths
1,452
Sq Ft
$180/Sq Ft
Est. Value
About This Home
This home is located at 708 S Emerson Ave, Gillette, WY 82716 and is currently estimated at $260,727, approximately $179 per square foot. 708 S Emerson Ave is a home located in Campbell County with nearby schools including Westwood High School, Meadowlark Elementary School, and Twin Spruce Junior High School.
Ownership History
Date
Name
Owned For
Owner Type
Purchase Details
Closed on
Dec 30, 2022
Sold by
Post Morgan C and Post Kimber C
Bought by
Kuchy Margaret A
Current Estimated Value
Purchase Details
Closed on
Oct 6, 2008
Sold by
Schultz Denee M
Bought by
York Ii Hassell Ray and Totten Leanna
Home Financials for this Owner
Home Financials are based on the most recent Mortgage that was taken out on this home.
Original Mortgage
$176,750
Interest Rate
6.52%
Mortgage Type
FHA
Purchase Details
Closed on
Feb 14, 2005
Sold by
Brown R B and Brown Patricia
Bought by
Schultz Deneen M
Home Financials for this Owner
Home Financials are based on the most recent Mortgage that was taken out on this home.
Original Mortgage
$95,000
Interest Rate
5.71%
Mortgage Type
Construction
Create a Home Valuation Report for This Property
The Home Valuation Report is an in-depth analysis detailing your home's value as well as a comparison with similar homes in the area
Home Values in the Area
Average Home Value in this Area
Purchase History
| Date | Buyer | Sale Price | Title Company |
|---|---|---|---|
| Kuchy Margaret A | -- | First American Title | |
| York Ii Hassell Ray | -- | None Available | |
| Schultz Deneen M | -- | Stewart Title Company Of Gil |
Source: Public Records
Mortgage History
| Date | Status | Borrower | Loan Amount |
|---|---|---|---|
| Previous Owner | York Ii Hassell Ray | $176,750 | |
| Previous Owner | Schultz Deneen M | $95,000 |
Source: Public Records
Tax History Compared to Growth
Tax History
| Year | Tax Paid | Tax Assessment Tax Assessment Total Assessment is a certain percentage of the fair market value that is determined by local assessors to be the total taxable value of land and additions on the property. | Land | Improvement |
|---|---|---|---|---|
| 2025 | $1,399 | $17,027 | $2,630 | $14,397 |
| 2024 | $1,399 | $19,897 | $3,605 | $16,292 |
| 2023 | $1,281 | $18,204 | $3,605 | $14,599 |
| 2022 | $1,149 | $16,292 | $3,130 | $13,162 |
| 2021 | $1,052 | $15,413 | $3,130 | $12,283 |
| 2020 | $1,037 | $15,233 | $3,130 | $12,103 |
| 2019 | $1,068 | $15,733 | $3,130 | $12,603 |
| 2018 | $974 | $14,410 | $3,130 | $11,280 |
| 2017 | $1,045 | $15,489 | $2,517 | $12,972 |
| 2016 | $1,052 | $15,579 | $2,517 | $13,062 |
| 2015 | -- | $13,079 | $2,517 | $10,562 |
| 2014 | -- | $12,583 | $2,517 | $10,066 |
Source: Public Records
Map
Nearby Homes
- 409 S Emerson Ave
- 700 S Brooks Ave
- 304 S Emerson Ave
- 706 S Gillette Ave
- 609 S Miller Ave
- 808 S Gillette Ave
- 911 S Warren Ave
- 308 S Warren Ave
- 425 Circle Dr
- 100 W Hogeye Dr
- 816 E 9th St
- 819 E 12th St
- 907 E 4th St
- 309 Rockpile Blvd
- 207 N Bundy Ave
- 905 S Gurley Ave
- 1005 Santee Dr
- 103 E Valley Dr
- 410 N Osborne Ave
- 1028 E 9th St
- 708 S Emerson Ave -
- 307 E 8th St
- 704 S Emerson Ave
- 702 S Emerson Ave
- 700 S Emerson Ave
- 709 Carey Ave
- 705 Carey Ave
- 703 Carey Ave
- 701 S Emerson Ave
- 701 Carey Ave
- 404 E 7th St
- 311 E 7th St
- 407 E 8th St
- 611 Carey Ave
- 704 S Osborne Ave
- 406 E 7th St
- 611 S Emerson Ave
- 702 S Osborne Ave
- 702 Carey Ave
- 606 S Emerson Ave