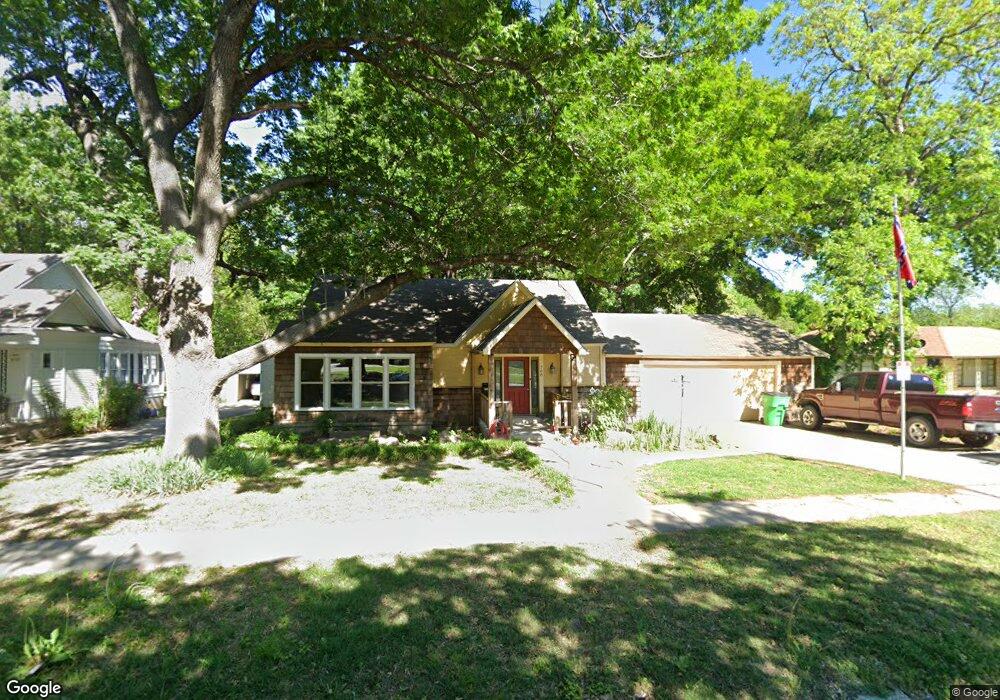
708 S Lindsay St Gainesville, TX 76240
Estimated Value: $276,000 - $374,000
4
Beds
2
Baths
2,528
Sq Ft
$122/Sq Ft
Est. Value
About This Home
This home is located at 708 S Lindsay St, Gainesville, TX 76240 and is currently estimated at $309,660, approximately $122 per square foot. 708 S Lindsay St is a home located in Cooke County with nearby schools including Edison Elementary School, W.E. Chalmers Elementary School, and Gainesville Jr. High School.
Ownership History
Date
Name
Owned For
Owner Type
Purchase Details
Closed on
Oct 17, 2016
Sold by
Singietary William Careth and Singietary William G
Bought by
Glidewell Alvis
Current Estimated Value
Home Financials for this Owner
Home Financials are based on the most recent Mortgage that was taken out on this home.
Original Mortgage
$129,292
Outstanding Balance
$103,373
Interest Rate
3.46%
Mortgage Type
New Conventional
Estimated Equity
$206,287
Purchase Details
Closed on
Jan 30, 2015
Sold by
Cason Cathy J and Brown Robin
Bought by
Singletary William Gareth and Singletary William G
Home Financials for this Owner
Home Financials are based on the most recent Mortgage that was taken out on this home.
Original Mortgage
$110,462
Interest Rate
4.25%
Mortgage Type
FHA
Create a Home Valuation Report for This Property
The Home Valuation Report is an in-depth analysis detailing your home's value as well as a comparison with similar homes in the area
Home Values in the Area
Average Home Value in this Area
Purchase History
| Date | Buyer | Sale Price | Title Company |
|---|---|---|---|
| Glidewell Alvis | -- | None Available | |
| Singletary William Gareth | -- | Howeth Title Company |
Source: Public Records
Mortgage History
| Date | Status | Borrower | Loan Amount |
|---|---|---|---|
| Open | Glidewell Alvis | $129,292 | |
| Previous Owner | Singletary William Gareth | $110,462 |
Source: Public Records
Tax History Compared to Growth
Tax History
| Year | Tax Paid | Tax Assessment Tax Assessment Total Assessment is a certain percentage of the fair market value that is determined by local assessors to be the total taxable value of land and additions on the property. | Land | Improvement |
|---|---|---|---|---|
| 2025 | $3,529 | $254,681 | $39,977 | $224,152 |
| 2024 | $3,529 | $264,125 | $39,973 | $224,152 |
| 2023 | $4,129 | $210,480 | $33,232 | $229,596 |
| 2022 | $4,166 | $240,024 | $33,232 | $206,792 |
| 2021 | $4,479 | $173,950 | $19,595 | $154,355 |
| 2020 | $4,225 | $159,557 | $19,595 | $139,962 |
| 2019 | $3,953 | $148,214 | $19,595 | $128,619 |
| 2018 | $3,588 | $131,477 | $14,578 | $116,899 |
| 2017 | $3,426 | $126,037 | $14,578 | $111,459 |
| 2015 | -- | $116,144 | $14,578 | $101,566 |
| 2014 | -- | $113,824 | $13,168 | $100,656 |
Source: Public Records
Map
Nearby Homes
- 625 S Denton St
- 724 S Rusk St
- 215 Bell St
- 803 S Rusk St
- 928 S Lindsay St
- 817 S Rusk St
- 709 E Garnett St
- 921 & 923 S Rusk St
- 319 S Denton St
- 121 W Tennie St
- 809 Truelove St
- 20 Shadowood Ln
- 502 S Chestnut St
- 935 S Dixon St
- 1013 Murphy St
- 505 S Grand Ave
- 1108 S Morris St
- 701 S Clements St
- 410 S Grand Ave
- 1118 S Grand Ave
- 716 S Lindsay St
- 704 S Lindsay St
- 700 S Lindsay St
- 726 S Lindsay St
- 802 S Lindsay St
- 715 S Lindsay St
- 628 S Lindsay St
- 731 S Lindsay St
- 810 S Lindsay St
- 626 S Lindsay St
- 805 Lindsay St
- 806 Lindsay St
- 805 S Lindsay St
- 631 S Lindsay St
- 809 Lindsay St
- 620 S Lindsay St
- 801 S Lindsay St
- 410 E Tennie St
- 625 S Lindsay St
- 616 S Lindsay St