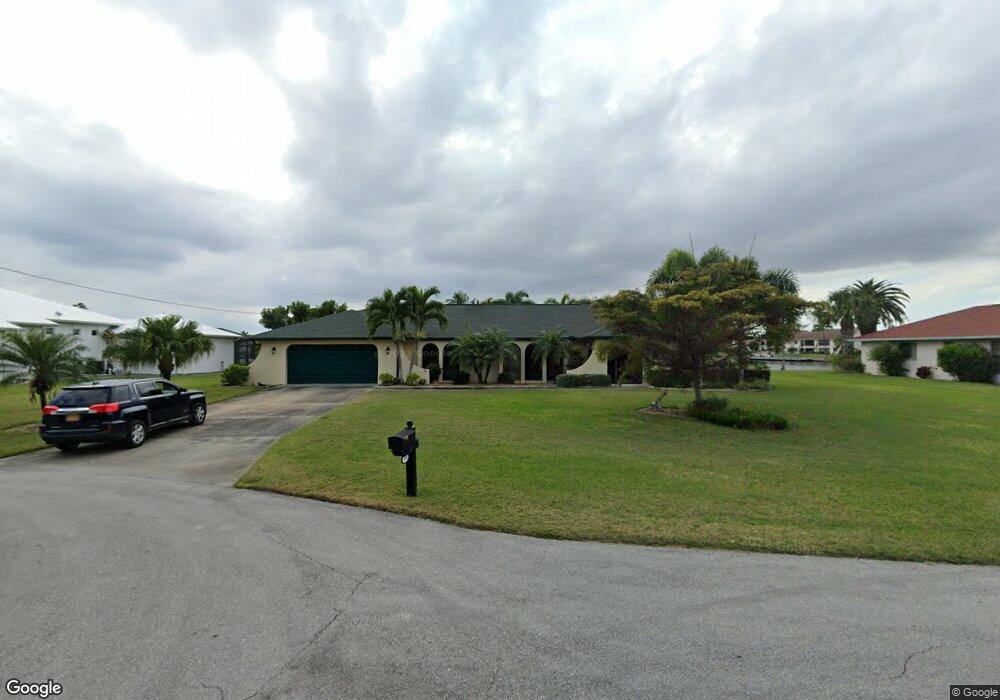
708 SE 43rd Terrace Unit 9 Cape Coral, FL 33904
Caloosahatchee NeighborhoodEstimated Value: $578,000 - $752,000
3
Beds
2
Baths
3,315
Sq Ft
$205/Sq Ft
Est. Value
About This Home
This home is located at 708 SE 43rd Terrace Unit 9, Cape Coral, FL 33904 and is currently estimated at $679,090, approximately $204 per square foot. 708 SE 43rd Terrace Unit 9 is a home located in Lee County with nearby schools including Cape Elementary School, Caloosa Elementary School, and Tropic Isles Elementary School.
Ownership History
Date
Name
Owned For
Owner Type
Purchase Details
Closed on
Jul 26, 2011
Sold by
Anw3 Llc
Bought by
Wood Barry M and Wood Shirley A
Current Estimated Value
Home Financials for this Owner
Home Financials are based on the most recent Mortgage that was taken out on this home.
Original Mortgage
$272,800
Outstanding Balance
$187,855
Interest Rate
4.53%
Mortgage Type
New Conventional
Estimated Equity
$491,235
Purchase Details
Closed on
May 18, 2010
Sold by
Dickson Charles H
Bought by
Anw3 Llc
Purchase Details
Closed on
Jun 2, 2005
Sold by
Libretto Catherine Jean and Libretto Raymond
Bought by
Dickson Charles H
Home Financials for this Owner
Home Financials are based on the most recent Mortgage that was taken out on this home.
Original Mortgage
$444,000
Interest Rate
4.9%
Mortgage Type
Negative Amortization
Create a Home Valuation Report for This Property
The Home Valuation Report is an in-depth analysis detailing your home's value as well as a comparison with similar homes in the area
Home Values in the Area
Average Home Value in this Area
Purchase History
| Date | Buyer | Sale Price | Title Company |
|---|---|---|---|
| Wood Barry M | $341,000 | Title Professionals Of Fl | |
| Anw3 Llc | $219,600 | None Available | |
| Dickson Charles H | $555,000 | Jm Title Corporation |
Source: Public Records
Mortgage History
| Date | Status | Borrower | Loan Amount |
|---|---|---|---|
| Open | Wood Barry M | $272,800 | |
| Previous Owner | Dickson Charles H | $444,000 |
Source: Public Records
Tax History Compared to Growth
Tax History
| Year | Tax Paid | Tax Assessment Tax Assessment Total Assessment is a certain percentage of the fair market value that is determined by local assessors to be the total taxable value of land and additions on the property. | Land | Improvement |
|---|---|---|---|---|
| 2025 | $5,195 | $321,334 | -- | -- |
| 2024 | $5,195 | $312,278 | -- | -- |
| 2023 | $5,021 | $298,183 | $0 | $0 |
| 2022 | $4,809 | $294,352 | $0 | $0 |
| 2021 | $4,956 | $340,840 | $142,584 | $198,256 |
| 2020 | $5,038 | $281,833 | $0 | $0 |
| 2019 | $4,894 | $275,497 | $0 | $0 |
| 2018 | $4,891 | $270,360 | $0 | $0 |
| 2017 | $4,871 | $264,799 | $0 | $0 |
| 2016 | $4,772 | $259,353 | $124,038 | $135,315 |
| 2015 | $5,192 | $277,614 | $107,179 | $170,435 |
| 2014 | $5,245 | $282,094 | $104,480 | $177,614 |
| 2013 | -- | $294,107 | $100,248 | $193,859 |
Source: Public Records
Map
Nearby Homes
- 4507 SE 5th Place
- 4500 SE 5th Place Unit 105
- 726 SE 43rd Terrace
- 714 SE 43rd St
- 4521 SE 5th Place
- 734 SE 43rd St
- 4518 SE 6th Ct
- 4541 SE 5th Place Unit 207
- 4405 SE 8th Place
- 4218 SE 6th Place
- 4538 SE 5th Place Unit 3
- 4216 SE 7th Ave
- 4321 Country Club Blvd Unit 101
- 4411 Country Club Blvd Unit A2
- 4411 Country Club Blvd Unit A1
- 4417 Country Club Blvd Unit B6
- 4549 SE 5th Place Unit 211
- 4550 SE 5th Place Unit 202
- 820 SE 43rd St
- 913 SE 43rd Terrace
- 702 SE 43rd Terrace
- 712 SE 43rd Terrace
- 716 SE 43rd Terrace
- 717 SE 43rd Terrace
- 4500 SE 5th Place Unit 206
- 4500 SE 5th Place Unit 103
- 4500 SE 5th Place Unit 205
- 4500 SE 5th Place Unit 204
- 4500 SE 5th Place Unit 203
- 4500 SE 5th Place Unit 106
- 4500 SE 5th Place Unit 104
- 4511 SE 5th Place Unit A
- 4511 SE 5th Place
- 4511 SE 5th Place Unit B
- 4511 SE 5th Place Unit A-B
- 721 SE 43rd Terrace
- 702 SE 44th St
- 722 SE 43rd Terrace
- 725 SE 43rd Terrace
- 711 SE 44th St