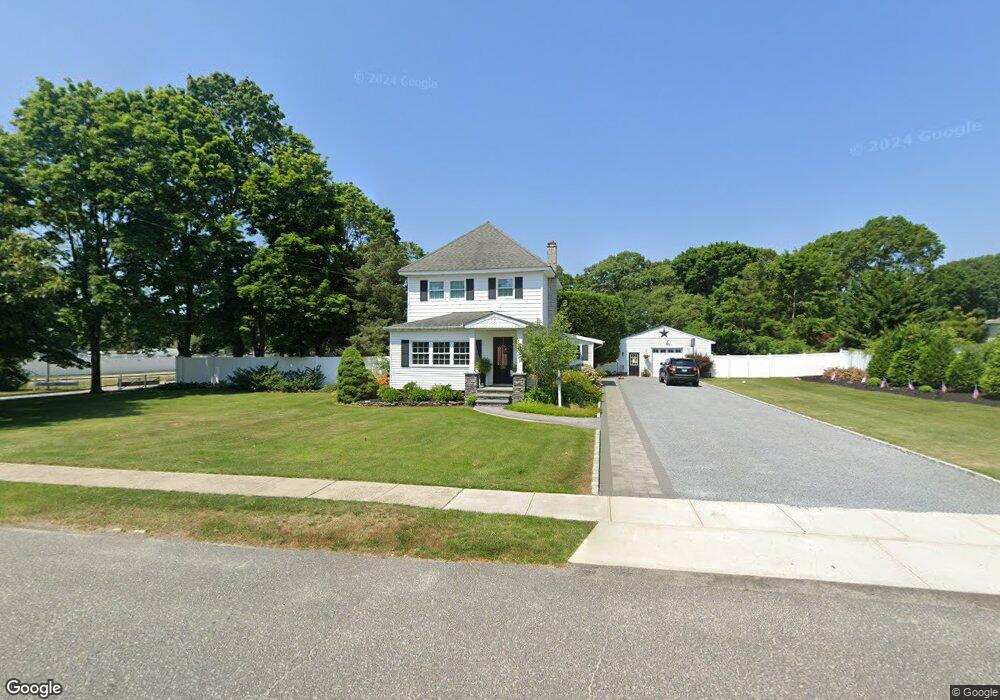
708 Sylvan Ave Bayport, NY 11705
Estimated Value: $600,505 - $975,000
--
Bed
--
Bath
--
Sq Ft
1.2
Acres
About This Home
This home is located at 708 Sylvan Ave, Bayport, NY 11705 and is currently estimated at $736,876. 708 Sylvan Ave is a home located in Suffolk County with nearby schools including James Wilson Young Middle School and Bayport Blue Point High School.
Ownership History
Date
Name
Owned For
Owner Type
Purchase Details
Closed on
Feb 13, 1998
Sold by
Borgstede Robert and Borgstede Karlene
Bought by
Cirone Alfred J and Cirone Adrienne M
Current Estimated Value
Home Financials for this Owner
Home Financials are based on the most recent Mortgage that was taken out on this home.
Original Mortgage
$146,150
Outstanding Balance
$25,689
Interest Rate
6.92%
Mortgage Type
FHA
Estimated Equity
$711,187
Create a Home Valuation Report for This Property
The Home Valuation Report is an in-depth analysis detailing your home's value as well as a comparison with similar homes in the area
Home Values in the Area
Average Home Value in this Area
Purchase History
| Date | Buyer | Sale Price | Title Company |
|---|---|---|---|
| Cirone Alfred J | $151,000 | Chicago Title Insurance Co | |
| Cirone Alfred J | $151,000 | Chicago Title Insurance Co |
Source: Public Records
Mortgage History
| Date | Status | Borrower | Loan Amount |
|---|---|---|---|
| Open | Cirone Alfred J | $146,150 | |
| Closed | Cirone Alfred J | $146,150 |
Source: Public Records
Tax History Compared to Growth
Tax History
| Year | Tax Paid | Tax Assessment Tax Assessment Total Assessment is a certain percentage of the fair market value that is determined by local assessors to be the total taxable value of land and additions on the property. | Land | Improvement |
|---|---|---|---|---|
| 2024 | $15,513 | $43,300 | $16,200 | $27,100 |
| 2023 | $15,513 | $43,300 | $16,200 | $27,100 |
| 2022 | $11,804 | $43,300 | $16,200 | $27,100 |
| 2021 | $11,804 | $43,300 | $16,200 | $27,100 |
| 2020 | $13,710 | $43,300 | $16,200 | $27,100 |
| 2019 | $13,710 | $43,300 | $16,200 | $27,100 |
| 2018 | -- | $43,300 | $16,200 | $27,100 |
| 2017 | $11,961 | $43,300 | $16,200 | $27,100 |
| 2016 | $11,606 | $43,300 | $16,200 | $27,100 |
| 2015 | -- | $43,300 | $16,200 | $27,100 |
| 2014 | -- | $43,300 | $16,200 | $27,100 |
Source: Public Records
Map
Nearby Homes
- 0 Sylvan Ave
- 510 Bayport Ave
- 92 Barrett Ave
- 462 Bayport Ave
- 41 Eatondale Ave
- 2 Oyster Cove Ln
- 63 Division Ave
- 6 Oyster Cove Ln
- 677 Montauk Hwy
- 181 Blue Point Ave
- 92 Park St
- 230 Kensington Ave
- 7 Kent Ct
- 64 Highland Ave
- 81 Old Broadway Ave
- 21 S Summit Ave
- 49 S Summit Ave
- 48 Lumur Dr
- 26 Lakeland Ave
- 186 Halley Dr