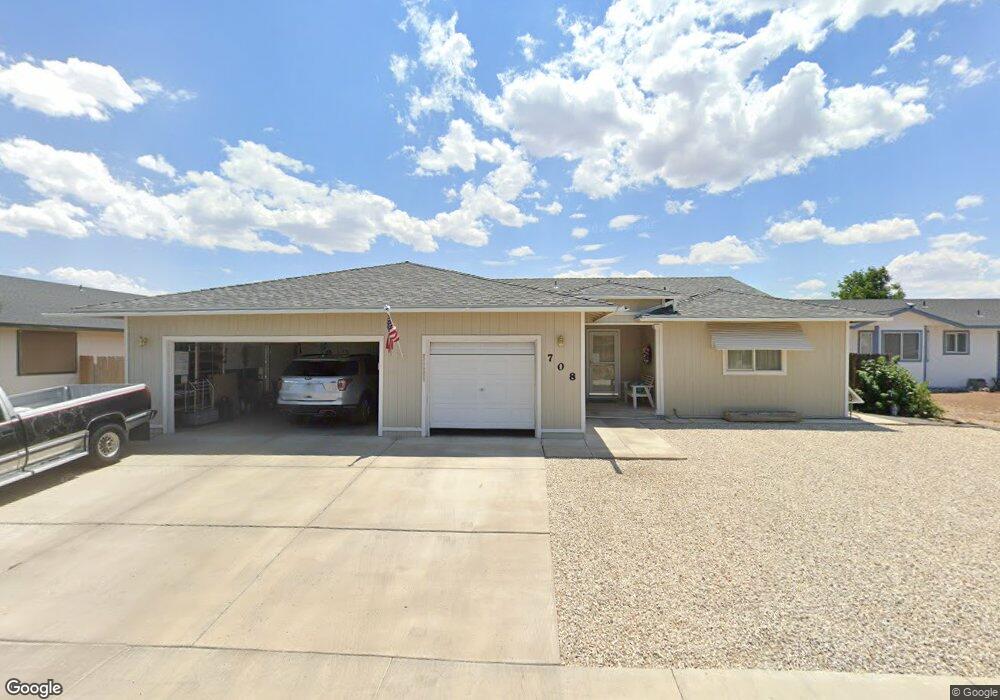
708 Todd Ct Fernley, NV 89408
Estimated Value: $417,000 - $468,000
4
Beds
2
Baths
2,428
Sq Ft
$183/Sq Ft
Est. Value
About This Home
This home is located at 708 Todd Ct, Fernley, NV 89408 and is currently estimated at $443,761, approximately $182 per square foot. 708 Todd Ct is a home located in Lyon County with nearby schools including Fernley Elementary School, Fernley Intermediate School, and Fernley High School.
Ownership History
Date
Name
Owned For
Owner Type
Purchase Details
Closed on
Dec 27, 2007
Sold by
The Emery Revocable Inter Vivos Trust and Emery Stephen A
Bought by
Emery Stephen Anthony and Emery Eliza Sybil Mary
Current Estimated Value
Create a Home Valuation Report for This Property
The Home Valuation Report is an in-depth analysis detailing your home's value as well as a comparison with similar homes in the area
Home Values in the Area
Average Home Value in this Area
Purchase History
| Date | Buyer | Sale Price | Title Company |
|---|---|---|---|
| Emery Stephen Anthony | -- | None Available |
Source: Public Records
Tax History Compared to Growth
Tax History
| Year | Tax Paid | Tax Assessment Tax Assessment Total Assessment is a certain percentage of the fair market value that is determined by local assessors to be the total taxable value of land and additions on the property. | Land | Improvement |
|---|---|---|---|---|
| 2025 | $639 | $91,470 | $49,000 | $77,870 |
| 2024 | $1,029 | $93,160 | $49,000 | $78,559 |
| 2023 | $2,111 | $119,379 | $0 | $0 |
| 2022 | $2,030 | $117,838 | $49,000 | $68,838 |
| 2021 | $2,016 | $112,676 | $45,500 | $67,176 |
| 2020 | $1,963 | $93,376 | $29,750 | $63,626 |
| 2019 | $1,934 | $91,157 | $29,750 | $61,407 |
| 2018 | $1,894 | $84,485 | $24,500 | $59,985 |
| 2017 | $1,883 | $77,526 | $17,500 | $60,026 |
| 2016 | $1,689 | $64,017 | $5,780 | $58,237 |
| 2015 | $1,725 | $48,278 | $5,780 | $42,498 |
| 2014 | $1,687 | $41,428 | $5,780 | $35,648 |
Source: Public Records
Map
Nearby Homes