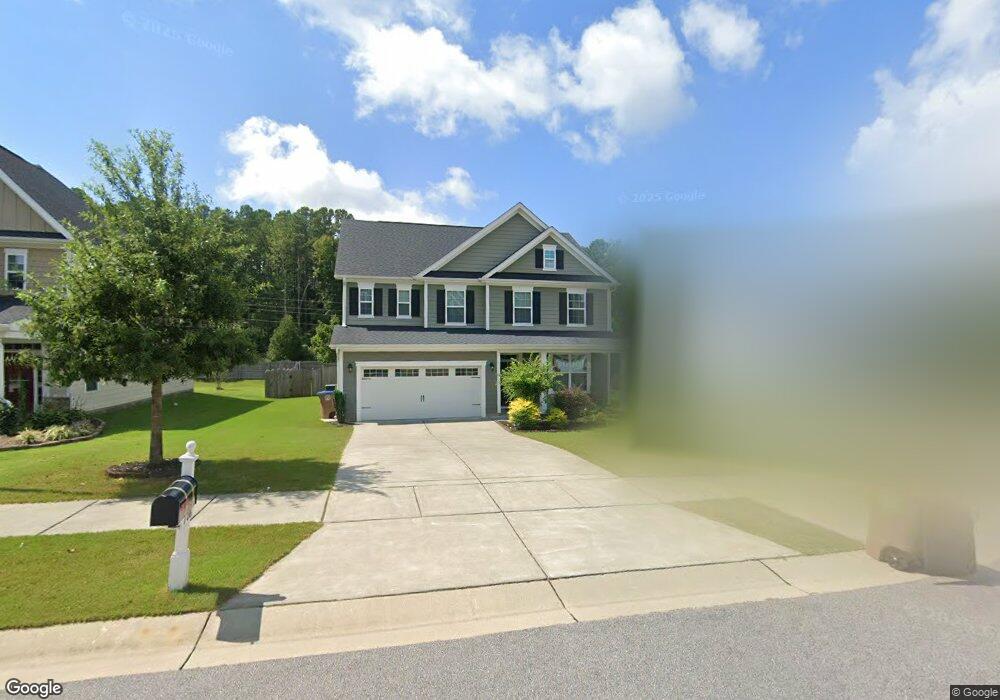
708 Tree Green Ln Wake Forest, NC 27587
Estimated Value: $544,000 - $576,000
3
Beds
3
Baths
3,006
Sq Ft
$185/Sq Ft
Est. Value
About This Home
This home is located at 708 Tree Green Ln, Wake Forest, NC 27587 and is currently estimated at $555,470, approximately $184 per square foot. 708 Tree Green Ln is a home located in Wake County with nearby schools including Jones Dairy Elementary School, Heritage Middle School, and Wake Forest High School.
Ownership History
Date
Name
Owned For
Owner Type
Purchase Details
Closed on
Jul 1, 2016
Sold by
Nucompass Mobility Services Inc
Bought by
Kion Ali and Ghahremeani Marzieh
Current Estimated Value
Home Financials for this Owner
Home Financials are based on the most recent Mortgage that was taken out on this home.
Original Mortgage
$271,225
Outstanding Balance
$214,186
Interest Rate
3.25%
Mortgage Type
FHA
Estimated Equity
$341,284
Purchase Details
Closed on
Feb 13, 2016
Sold by
Rivera Walter and Rivera Jennifer M
Bought by
Nucompass Mobility Services Inc
Purchase Details
Closed on
Sep 17, 2014
Sold by
Beazer Homes Corp
Bought by
Rivera Walter and Rivera Jennifer M
Home Financials for this Owner
Home Financials are based on the most recent Mortgage that was taken out on this home.
Original Mortgage
$276,915
Interest Rate
4.2%
Mortgage Type
New Conventional
Create a Home Valuation Report for This Property
The Home Valuation Report is an in-depth analysis detailing your home's value as well as a comparison with similar homes in the area
Home Values in the Area
Average Home Value in this Area
Purchase History
| Date | Buyer | Sale Price | Title Company |
|---|---|---|---|
| Kion Ali | $285,500 | None Available | |
| Nucompass Mobility Services Inc | $285,500 | None Available | |
| Rivera Walter | $291,500 | None Available |
Source: Public Records
Mortgage History
| Date | Status | Borrower | Loan Amount |
|---|---|---|---|
| Open | Kion Ali | $271,225 | |
| Previous Owner | Rivera Walter | $276,915 |
Source: Public Records
Tax History
| Year | Tax Paid | Tax Assessment Tax Assessment Total Assessment is a certain percentage of the fair market value that is determined by local assessors to be the total taxable value of land and additions on the property. | Land | Improvement |
|---|---|---|---|---|
| 2025 | $5,149 | $534,430 | $90,000 | $444,430 |
| 2024 | $5,130 | $534,430 | $90,000 | $444,430 |
Source: Public Records
Map
Nearby Homes
- 1020 Sun Springs Rd
- 685 Sun Meadow Dr
- 681 Sun Meadow Dr
- 677 Sun Meadow Dr
- 1108 Sun Springs Rd
- 505 Morning Glade St
- 1112 Sun Springs Rd
- 1224 Legacy Greene Ave
- 1116 Sun Springs Rd
- 1120 Sun Springs Rd
- 1341 Legacy Greene Ave
- 1709 Glazebrook Dr
- 621 Sun Meadow Dr
- 1304 Litchborough Way
- 1317 Plunket Dr
- 1005 Chalk Rd
- 1613 Marshall Farm St
- 940 Skylar Ct
- 504 Sun Meadow Dr
- 1736 Fern Hollow Trail
- 712 Tree Green Ln
- 704 Tree Green Ln
- 716 Tree Green Ln
- 700 Tree Green Ln
- 713 Tree Green Ln
- 709 Tree Green Ln
- 701 Tree Green Ln
- 720 Tree Green Ln
- 705 Tree Green Ln
- 717 Tree Green Ln
- 724 Tree Green Ln
- 721 Tree Green Ln
- 1404 Green Edge Trail
- 700 Jones Dairy Rd
- 704 Jones Dairy Rd
- 1024 Shuford Rd
- 1024 Shuford Rd Unit 1
- 1024 Shuford Rd Unit 3
- 1408 Green Edge Trail
- 725 Tree Green Ln
Your Personal Tour Guide
Ask me questions while you tour the home.