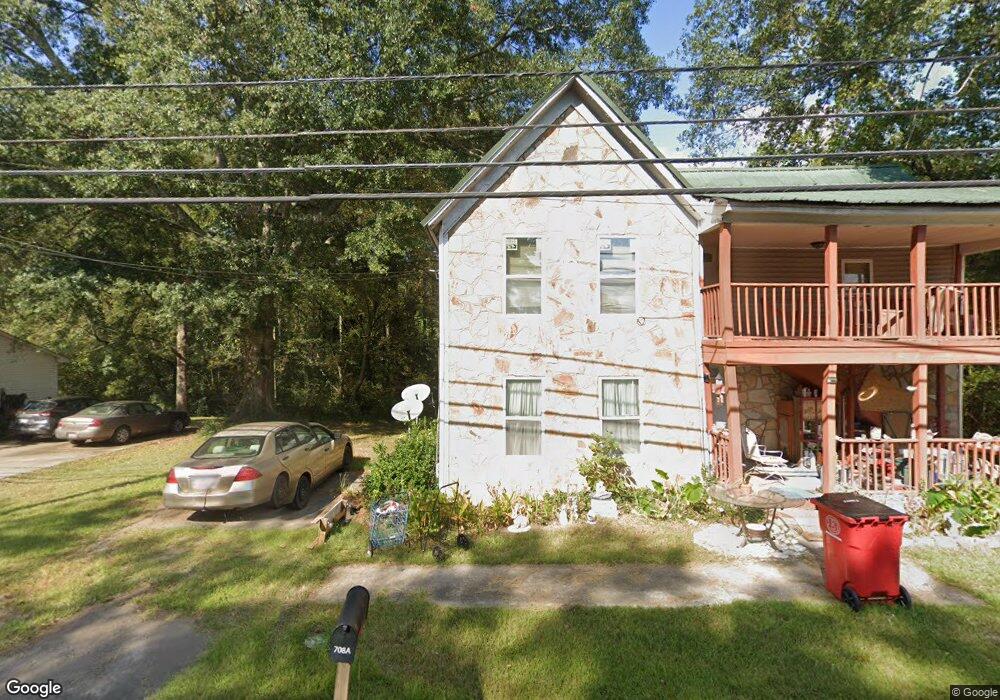
708 W College St Bowdon, GA 30108
Estimated Value: $202,000 - $258,000
3
Beds
2
Baths
1,894
Sq Ft
$120/Sq Ft
Est. Value
About This Home
This home is located at 708 W College St, Bowdon, GA 30108 and is currently estimated at $226,918, approximately $119 per square foot. 708 W College St is a home located in Carroll County with nearby schools including Bowdon Elementary School, Bowdon Middle School, and Bowdon High School.
Ownership History
Date
Name
Owned For
Owner Type
Purchase Details
Closed on
Mar 12, 2007
Sold by
Deutsche Bank
Bought by
Brown Christopher J
Current Estimated Value
Home Financials for this Owner
Home Financials are based on the most recent Mortgage that was taken out on this home.
Original Mortgage
$55,000
Outstanding Balance
$32,886
Interest Rate
6.22%
Mortgage Type
New Conventional
Estimated Equity
$194,032
Purchase Details
Closed on
Mar 7, 2006
Sold by
Not Provided
Bought by
Brown Christopher J
Purchase Details
Closed on
Sep 16, 2002
Sold by
Endsley Zoe R
Bought by
Sanders Michael O
Purchase Details
Closed on
Mar 30, 2000
Sold by
Spangler Gary P
Bought by
Endsley Zoe R
Purchase Details
Closed on
Nov 18, 1998
Sold by
Robison Joel
Bought by
Spangler Gary P
Purchase Details
Closed on
Mar 25, 1994
Sold by
Robison Joel
Bought by
Robison Joel
Purchase Details
Closed on
Jul 20, 1992
Sold by
Robison Joel
Bought by
Robison Joel
Purchase Details
Closed on
Jun 22, 1992
Bought by
Robison Joel
Create a Home Valuation Report for This Property
The Home Valuation Report is an in-depth analysis detailing your home's value as well as a comparison with similar homes in the area
Home Values in the Area
Average Home Value in this Area
Purchase History
| Date | Buyer | Sale Price | Title Company |
|---|---|---|---|
| Brown Christopher J | $52,900 | -- | |
| Brown Christopher J | -- | -- | |
| Sanders Michael O | $65,500 | -- | |
| Endsley Zoe R | $76,000 | -- | |
| Spangler Gary P | $60,000 | -- | |
| Robison Joel | -- | -- | |
| Robison Joel | -- | -- | |
| Robison Joel | $28,000 | -- |
Source: Public Records
Mortgage History
| Date | Status | Borrower | Loan Amount |
|---|---|---|---|
| Open | Brown Christopher J | $55,000 |
Source: Public Records
Tax History
| Year | Tax Paid | Tax Assessment Tax Assessment Total Assessment is a certain percentage of the fair market value that is determined by local assessors to be the total taxable value of land and additions on the property. | Land | Improvement |
|---|---|---|---|---|
| 2025 | $2,155 | $75,091 | $8,892 | $66,199 |
| 2024 | $2,184 | $75,091 | $8,892 | $66,199 |
| 2023 | $2,184 | $69,053 | $8,892 | $60,161 |
| 2022 | $1,574 | $48,613 | $5,914 | $42,699 |
| 2021 | $1,368 | $41,024 | $4,380 | $36,644 |
| 2020 | $1,266 | $37,654 | $4,380 | $33,274 |
| 2019 | $1,157 | $33,946 | $4,380 | $29,566 |
| 2018 | $1,164 | $33,406 | $4,380 | $29,026 |
| 2017 | $1,166 | $33,406 | $4,380 | $29,026 |
| 2016 | $1,049 | $35,338 | $4,380 | $30,958 |
| 2015 | $1,021 | $27,931 | $4,487 | $23,444 |
| 2014 | $1,026 | $27,932 | $4,487 | $23,444 |
Source: Public Records
Map
Nearby Homes
- 301 Angela Ave Unit 8
- 301 Angela Ave
- 309 Angela Ave Unit 6
- 309 Angela Ave
- 255 Eason St
- 263 Eason St
- 267 Eason St
- 267 Eason St Unit 13
- 714 Yates Rd
- 313 Ellenwood Dr
- 310 W College St
- 0 Bartlett Cir Unit 10666514
- 101 Winding Road - Lot 1a & 1b & Lot 2
- 0 Hwy 100 Unit LotWP001 24911780
- 0 Hwy 100 Unit 10541558
- 485 West Ave
- 110 Bevis Cir
- 414 Wedowee St
- 6.41 ac N Carroll St & Ave W
- 627 Wedowee St
- 709 W College St
- 113 Eason St
- 714 W College St
- 108 Eason St
- 201 Eason St
- 614 W College St
- 617 Adamson Ave
- 108 Elm St
- 721 W College St
- 107 Elm St
- 205 Eason St
- 611 Adamson Ave
- 604 W College St
- 728 W College St
- 720 W College St
- 115 Elm St
- 225 Angela Ave
- 725 W College St
- 600 W College St
- 606 Mitchell Ave
Your Personal Tour Guide
Ask me questions while you tour the home.