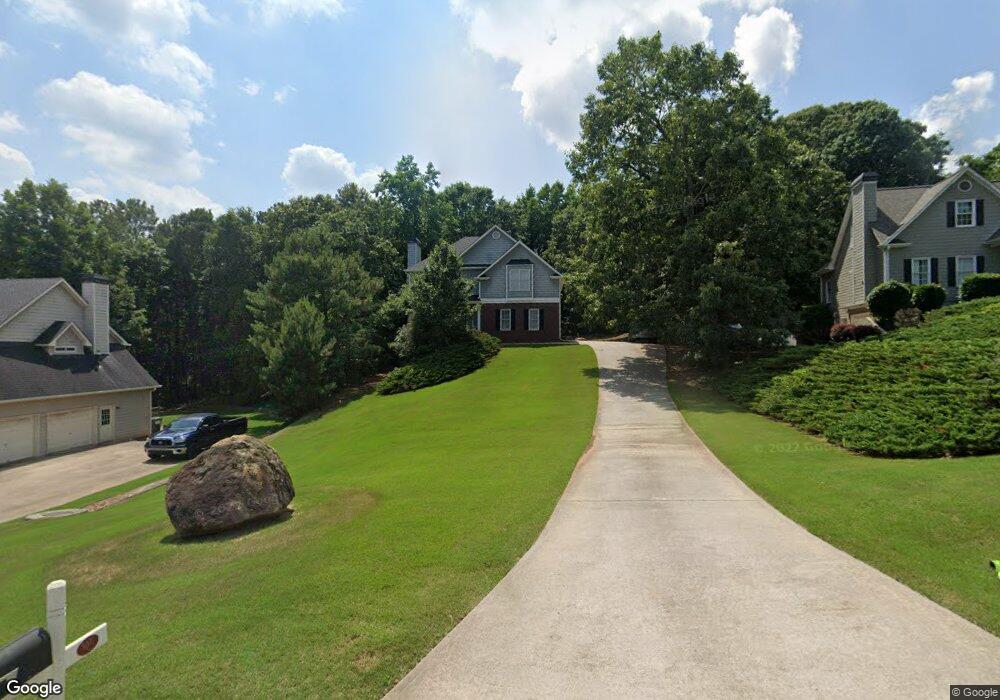
708 Walnut Ln Woodstock, GA 30188
Union Hill NeighborhoodEstimated Value: $498,000 - $532,034
4
Beds
3
Baths
1,985
Sq Ft
$259/Sq Ft
Est. Value
About This Home
This home is located at 708 Walnut Ln, Woodstock, GA 30188 and is currently estimated at $515,017, approximately $259 per square foot. 708 Walnut Ln is a home located in Cherokee County with nearby schools including Holly Springs Elementary School, Rusk Middle School, and Sequoyah High School.
Ownership History
Date
Name
Owned For
Owner Type
Purchase Details
Closed on
Jan 31, 2011
Sold by
Mortgage Guaranty Ins Mgic
Bought by
Quackenbush Jordan M and Quackenbush Amy S
Current Estimated Value
Home Financials for this Owner
Home Financials are based on the most recent Mortgage that was taken out on this home.
Original Mortgage
$137,035
Outstanding Balance
$92,946
Interest Rate
4.75%
Mortgage Type
FHA
Estimated Equity
$422,071
Purchase Details
Closed on
Apr 14, 2010
Sold by
Federal Home Loan Mortgage Corporation
Bought by
Mortgage Guaranty Ins Mgic
Purchase Details
Closed on
Mar 2, 2010
Sold by
Jugovich Timothy J
Bought by
Chase Hm Fin Llc
Purchase Details
Closed on
May 27, 1999
Sold by
Kenny Hutson Construction Inc
Bought by
Jugovich Timothy J
Home Financials for this Owner
Home Financials are based on the most recent Mortgage that was taken out on this home.
Original Mortgage
$164,550
Interest Rate
6.9%
Create a Home Valuation Report for This Property
The Home Valuation Report is an in-depth analysis detailing your home's value as well as a comparison with similar homes in the area
Home Values in the Area
Average Home Value in this Area
Purchase History
| Date | Buyer | Sale Price | Title Company |
|---|---|---|---|
| Quackenbush Jordan M | $140,800 | -- | |
| Mortgage Guaranty Ins Mgic | -- | -- | |
| Chase Hm Fin Llc | $159,178 | -- | |
| Jugovich Timothy J | $173,300 | -- |
Source: Public Records
Mortgage History
| Date | Status | Borrower | Loan Amount |
|---|---|---|---|
| Open | Quackenbush Jordan M | $137,035 | |
| Previous Owner | Jugovich Timothy J | $164,550 |
Source: Public Records
Tax History Compared to Growth
Tax History
| Year | Tax Paid | Tax Assessment Tax Assessment Total Assessment is a certain percentage of the fair market value that is determined by local assessors to be the total taxable value of land and additions on the property. | Land | Improvement |
|---|---|---|---|---|
| 2025 | $4,990 | $190,000 | $46,000 | $144,000 |
| 2024 | $4,470 | $172,000 | $42,000 | $130,000 |
| 2023 | $4,474 | $172,160 | $42,000 | $130,160 |
| 2022 | $3,485 | $132,600 | $30,000 | $102,600 |
| 2021 | $3,122 | $109,960 | $26,000 | $83,960 |
| 2020 | $2,690 | $94,680 | $21,200 | $73,480 |
| 2019 | $2,471 | $86,960 | $20,000 | $66,960 |
| 2018 | $2,374 | $83,040 | $20,000 | $63,040 |
| 2017 | $2,287 | $198,400 | $20,000 | $59,360 |
| 2016 | $2,284 | $196,100 | $18,000 | $60,440 |
| 2015 | $2,085 | $177,300 | $16,000 | $54,920 |
| 2014 | $1,995 | $169,300 | $16,000 | $51,720 |
Source: Public Records
Map
Nearby Homes
- 1053 Walnut Creek Dr Unit I
- 528 Wisteria Dr
- 132 Little Brook Dr
- 312 Lady Slipper Ln
- 2065 Fairway Crossing Dr Unit IVA
- 1039 Avery Creek Dr
- 106 Village Ct
- 2058 Woodside Park Dr Unit 5A
- 555 Lower Birmingham Rd
- 3015 Bradshaw Club Dr Unit 1B
- 401 Trotters Run Unit 2
- 1265 Morgan Rd
- 512 S Holly Springs Rd
- 524 S Holly Springs Rd
- 254 Pine Trail
- 404 Billings Farm Dr
- 802 Clubhouse Pointe
- 704 Walnut Ln
- 712 Walnut Ln Unit 1
- 0 Walnut Ln Unit 8283209
- 0 Walnut Ln Unit 8662073
- 716 Walnut Ln
- 1046 Walnut Creek Dr Unit 1
- 700 Walnut Ln
- 1038 Walnut Creek Dr
- 720 Walnut Ln Unit 1
- 705 Walnut Ln
- 1036 Walnut Creek Dr
- 1042 Walnut Creek Dr
- 709 Walnut Ln Unit 1
- 1032 Walnut Creek Dr
- 713 Walnut Ln
- 724 Walnut Ln Unit 1
- 1056 Walnut Creek Dr
- 1028 Walnut Creek Dr Unit 1
- 717 Walnut Ln Unit 84
- 717 Walnut Ln