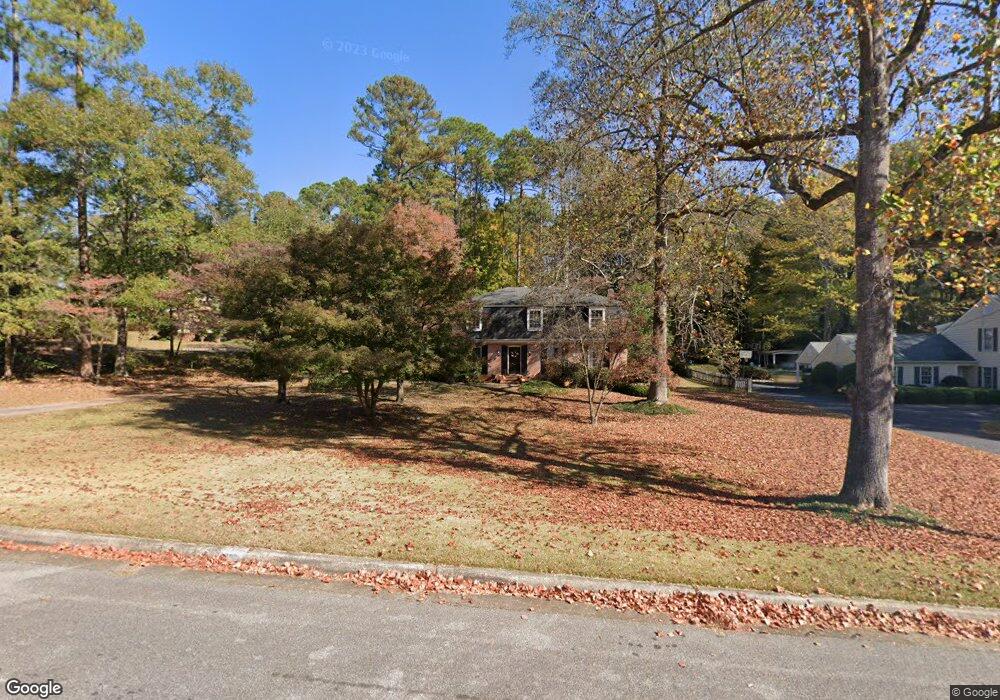
708 Wisteria Way Lagrange, GA 30240
Estimated Value: $397,354 - $443,000
4
Beds
3
Baths
3,094
Sq Ft
$138/Sq Ft
Est. Value
About This Home
This home is located at 708 Wisteria Way, Lagrange, GA 30240 and is currently estimated at $426,339, approximately $137 per square foot. 708 Wisteria Way is a home located in Troup County with nearby schools including Hollis Hand Elementary School, Franklin Forest Elementary School, and Ethel W. Kight Elementary School.
Ownership History
Date
Name
Owned For
Owner Type
Purchase Details
Closed on
Sep 18, 2020
Sold by
Alford Perrin J
Bought by
Sweet Nolen Paul
Current Estimated Value
Home Financials for this Owner
Home Financials are based on the most recent Mortgage that was taken out on this home.
Original Mortgage
$147,600
Outstanding Balance
$130,985
Interest Rate
2.9%
Mortgage Type
New Conventional
Estimated Equity
$295,354
Purchase Details
Closed on
Feb 17, 2003
Sold by
Perrin J Alford
Bought by
Alford Perrin J and Alford Sharon
Purchase Details
Closed on
Mar 1, 1999
Sold by
Larry James
Bought by
Perrin J Alford
Purchase Details
Closed on
Oct 28, 1998
Sold by
Larry D James
Bought by
Larry James
Purchase Details
Closed on
Jan 1, 1974
Bought by
Larry D James
Purchase Details
Closed on
Jan 1, 1973
Sold by
Piney Woods Co
Create a Home Valuation Report for This Property
The Home Valuation Report is an in-depth analysis detailing your home's value as well as a comparison with similar homes in the area
Home Values in the Area
Average Home Value in this Area
Purchase History
| Date | Buyer | Sale Price | Title Company |
|---|---|---|---|
| Sweet Nolen Paul | $247,600 | -- | |
| Alford Perrin J | -- | -- | |
| Perrin J Alford | -- | -- | |
| Larry James | $185,000 | -- | |
| Larry D James | $7,100 | -- | |
| -- | -- | -- |
Source: Public Records
Mortgage History
| Date | Status | Borrower | Loan Amount |
|---|---|---|---|
| Open | Sweet Nolen Paul | $147,600 |
Source: Public Records
Tax History Compared to Growth
Tax History
| Year | Tax Paid | Tax Assessment Tax Assessment Total Assessment is a certain percentage of the fair market value that is determined by local assessors to be the total taxable value of land and additions on the property. | Land | Improvement |
|---|---|---|---|---|
| 2024 | $3,351 | $122,884 | $18,000 | $104,884 |
| 2023 | $3,070 | $112,548 | $18,000 | $94,548 |
| 2022 | $2,932 | $105,068 | $18,000 | $87,068 |
| 2021 | $2,987 | $99,480 | $18,000 | $81,480 |
| 2020 | $2,313 | $76,680 | $16,000 | $60,680 |
| 2019 | $2,296 | $76,120 | $16,000 | $60,120 |
| 2018 | $2,210 | $73,280 | $16,000 | $57,280 |
| 2017 | $2,116 | $70,160 | $16,000 | $54,160 |
| 2016 | $2,123 | $70,381 | $16,000 | $54,381 |
| 2015 | $2,126 | $70,381 | $16,000 | $54,381 |
| 2014 | $2,027 | $66,979 | $16,000 | $50,979 |
| 2013 | -- | $73,114 | $16,000 | $57,114 |
Source: Public Records
Map
Nearby Homes
- 724 Camellia Dr
- 102 Ewing St
- 106 Ewing St
- 201 S Chilton Crescent
- 748 Lakewood Dr
- 203 S Chilton Crescent
- 145 Turner St
- 106 S Chilton Crescent
- 100 Creekside Dr Unit LOT 60A
- 107 Dixie Creek Dr
- 204 Colonial St
- 110 Russell St
- 900 North St
- 109 Thomas St
- 806 New Franklin Rd
- 219 Banks St
- 705 Piney Woods Dr
- 114 Briarcliff Rd
- 609 Cherokee Rd
- 603 Country Club Rd
- 706 Wisteria Way
- 302 Ivydale Dr
- 713 Wisteria Way
- 704 Wisteria Way
- 711 Wisteria Way
- 299 Ivydale Dr
- 300 Ivydale Dr
- 0 Ivydale Dr Unit 7310217
- 0 Ivydale Dr Unit 7245645
- 0 Ivydale Dr Unit 3214219
- 0 Ivydale Dr
- 709 Wisteria Way
- 202 Ivydale Dr
- 301 Ivydale Dr
- 719 Camellia Dr
- 801 Wisteria Way
- 717 Camellia Dr
- 707 Wisteria Way
- 802 Wisteria Way
- 803 Wisteria Way