Estimated Value: $119,000 - $173,000
4
Beds
2
Baths
1,080
Sq Ft
$132/Sq Ft
Est. Value
About This Home
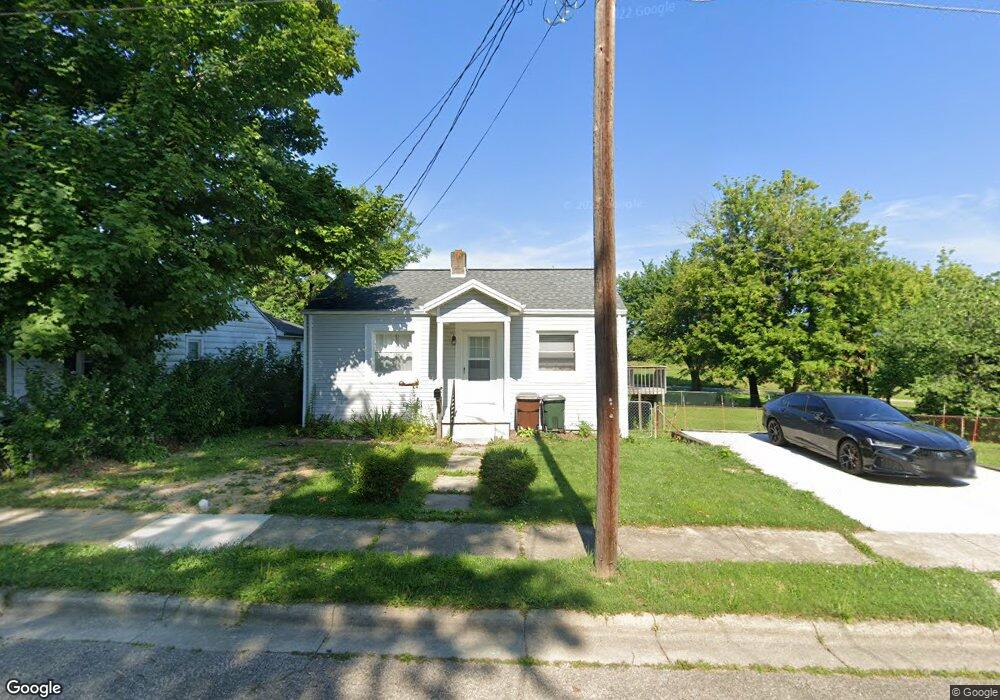
This home is located at 708 Xenia Ave, Xenia, OH 45385 and is currently estimated at $142,529, approximately $131 per square foot. 708 Xenia Ave is a home located in Greene County with nearby schools including Xenia High School, Summit Academy Community School for Alternative Learners - Xenia, and Legacy Christian Academy.
Ownership History
Date
Name
Owned For
Owner Type
Purchase Details
Closed on
Jan 8, 2021
Sold by
Mosley Ronald A
Bought by
Marlette William
Current Estimated Value
Home Financials for this Owner
Home Financials are based on the most recent Mortgage that was taken out on this home.
Original Mortgage
$113,500
Outstanding Balance
$101,228
Interest Rate
2.67%
Mortgage Type
VA
Estimated Equity
$41,301
Purchase Details
Closed on
Aug 10, 1989
Bought by
Mosley Ronald A
Create a Home Valuation Report for This Property
The Home Valuation Report is an in-depth analysis detailing your home's value as well as a comparison with similar homes in the area
Home Values in the Area
Average Home Value in this Area
Purchase History
| Date | Buyer | Sale Price | Title Company |
|---|---|---|---|
| Marlette William | $113,500 | Vantage Land Title | |
| Mosley Ronald A | $24,600 | -- |
Source: Public Records
Mortgage History
| Date | Status | Borrower | Loan Amount |
|---|---|---|---|
| Open | Marlette William | $113,500 |
Source: Public Records
Tax History Compared to Growth
Tax History
| Year | Tax Paid | Tax Assessment Tax Assessment Total Assessment is a certain percentage of the fair market value that is determined by local assessors to be the total taxable value of land and additions on the property. | Land | Improvement |
|---|---|---|---|---|
| 2024 | $1,617 | $37,780 | $2,600 | $35,180 |
| 2023 | $1,617 | $37,780 | $2,600 | $35,180 |
| 2022 | $1,414 | $28,180 | $2,080 | $26,100 |
| 2021 | $926 | $18,220 | $2,080 | $16,140 |
| 2020 | $888 | $18,220 | $2,080 | $16,140 |
| 2019 | $786 | $15,190 | $2,540 | $12,650 |
| 2018 | $789 | $15,190 | $2,540 | $12,650 |
| 2017 | $753 | $15,190 | $2,540 | $12,650 |
| 2016 | $754 | $14,240 | $2,540 | $11,700 |
| 2015 | $756 | $14,240 | $2,540 | $11,700 |
| 2014 | $724 | $14,240 | $2,540 | $11,700 |
Source: Public Records
Map
Nearby Homes