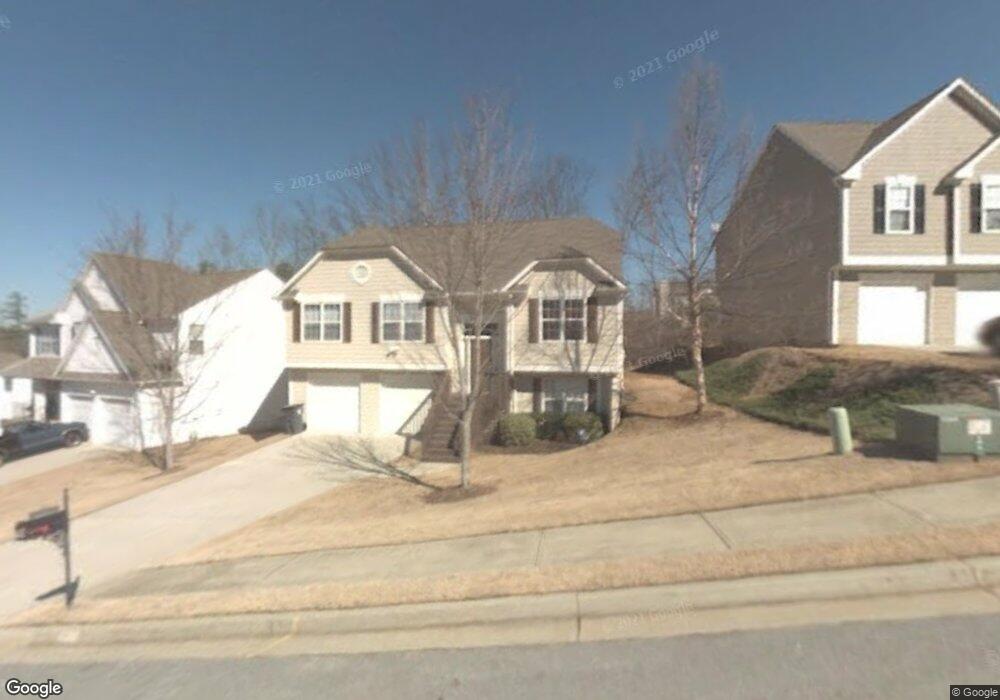
7085 Springgrove Ct Unit 27 Austell, GA 30168
Estimated Value: $315,448 - $342,000
4
Beds
3
Baths
1,998
Sq Ft
$163/Sq Ft
Est. Value
About This Home
This home is located at 7085 Springgrove Ct Unit 27, Austell, GA 30168 and is currently estimated at $324,862, approximately $162 per square foot. 7085 Springgrove Ct Unit 27 is a home located in Cobb County with nearby schools including Bryant Elementary School, Lindley Middle School, and Pebblebrook High School.
Ownership History
Date
Name
Owned For
Owner Type
Purchase Details
Closed on
Feb 28, 2017
Sold by
Farmer Markus D
Bought by
Farmer Markus D and Raqueal Peters
Current Estimated Value
Home Financials for this Owner
Home Financials are based on the most recent Mortgage that was taken out on this home.
Original Mortgage
$153,174
Outstanding Balance
$127,421
Interest Rate
4.37%
Mortgage Type
FHA
Estimated Equity
$197,441
Purchase Details
Closed on
Jun 15, 2000
Sold by
D R Horton Inc
Bought by
Gayle Robert A
Home Financials for this Owner
Home Financials are based on the most recent Mortgage that was taken out on this home.
Original Mortgage
$140,753
Interest Rate
8.54%
Mortgage Type
FHA
Create a Home Valuation Report for This Property
The Home Valuation Report is an in-depth analysis detailing your home's value as well as a comparison with similar homes in the area
Home Values in the Area
Average Home Value in this Area
Purchase History
| Date | Buyer | Sale Price | Title Company |
|---|---|---|---|
| Farmer Markus D | $156,000 | -- | |
| Farmer Markus D | $156,000 | -- | |
| Gayle Robert A | $140,900 | -- |
Source: Public Records
Mortgage History
| Date | Status | Borrower | Loan Amount |
|---|---|---|---|
| Open | Farmer Markus D | $153,174 | |
| Closed | Farmer Markus D | $153,174 | |
| Previous Owner | Gayle Robert A | $140,753 |
Source: Public Records
Tax History Compared to Growth
Tax History
| Year | Tax Paid | Tax Assessment Tax Assessment Total Assessment is a certain percentage of the fair market value that is determined by local assessors to be the total taxable value of land and additions on the property. | Land | Improvement |
|---|---|---|---|---|
| 2025 | $2,956 | $127,300 | $18,000 | $109,300 |
| 2024 | $2,959 | $127,300 | $18,000 | $109,300 |
| 2023 | $2,416 | $127,300 | $18,000 | $109,300 |
| 2022 | $2,578 | $108,824 | $16,000 | $92,824 |
| 2021 | $1,902 | $77,940 | $10,000 | $67,940 |
| 2020 | $1,597 | $64,004 | $10,000 | $54,004 |
| 2019 | $1,597 | $64,004 | $10,000 | $54,004 |
| 2018 | $1,409 | $55,444 | $10,000 | $45,444 |
| 2017 | $1,336 | $55,444 | $10,000 | $45,444 |
| 2016 | $1,074 | $46,260 | $10,000 | $36,260 |
| 2015 | $694 | $32,376 | $6,000 | $26,376 |
| 2014 | $699 | $32,376 | $0 | $0 |
Source: Public Records
Map
Nearby Homes
- 7151 Springchase Way
- 796 Crestside Ct Unit 1
- Townhomes at Crestview Floorplan at Crestview - Townhomes
- 7224 Crestside Dr Unit 1
- 937 Pine Oak Trail
- 761 Knox Springs Rd
- 967 Pine Hollow Rd
- 7249 Factory Shoals Rd
- 7063 Pleasant Dr
- 7067 Pleasant Dr
- 7282 Rockhouse Rd Unit 5
- 7098 Pleasant Dr
- 760 Wade Farm Dr
- 7254 Silverton Trail
- 1203 Park Center Cir
- 1199 Park Center Cir
- 1195 Park Center Cir
- 7085 Springgrove Ct Unit 2
- 7089 Springgrove Ct
- 7081 Springgrove Ct
- 7093 Springgrove Ct
- 7073 Springgrove Ct
- 705 Springgrove Ct
- 7172 Springchase Way
- 7082 Springgrove Ct
- 7078 Springgrove Ct
- 7180 Springchase Way Unit 1
- 7086 Springgrove Ct
- 7074 Springgrove Ct
- 7074 Springgrove Ct
- 7090 Springgrove Ct Unit 2
- 7069 Springgrove Ct Unit 2
- 7070 Springgrove Ct
- 7094 Springgrove Ct
- 6988 Chasewater Ln
- 7066 Springgrove Ct
- 7098 Springgrove Ct Unit 1