Estimated Value: $294,000 - $383,212
4
Beds
4
Baths
2,121
Sq Ft
$168/Sq Ft
Est. Value
About This Home
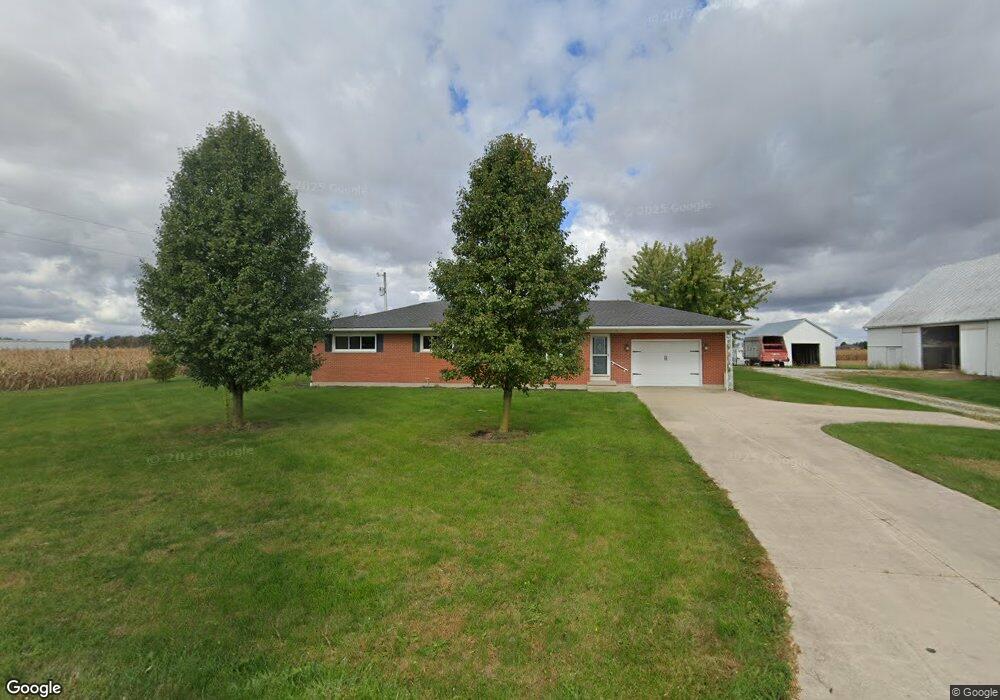
This home is located at 7087 Amsterdam Rd, Anna, OH 45302 and is currently estimated at $356,553, approximately $168 per square foot. 7087 Amsterdam Rd is a home located in Shelby County with nearby schools including Anna Elementary School, Anna Middle School, and Anna High School.
Ownership History
Date
Name
Owned For
Owner Type
Purchase Details
Closed on
Apr 5, 2024
Sold by
Riethman Shaun
Bought by
Albers Evan Patrick
Current Estimated Value
Home Financials for this Owner
Home Financials are based on the most recent Mortgage that was taken out on this home.
Original Mortgage
$175,000
Outstanding Balance
$103,320
Interest Rate
3.8%
Mortgage Type
New Conventional
Estimated Equity
$253,233
Purchase Details
Closed on
Jul 10, 2009
Sold by
Harting Rita L and Harting Rita L
Bought by
Riethman Shaun
Create a Home Valuation Report for This Property
The Home Valuation Report is an in-depth analysis detailing your home's value as well as a comparison with similar homes in the area
Home Values in the Area
Average Home Value in this Area
Purchase History
| Date | Buyer | Sale Price | Title Company |
|---|---|---|---|
| Albers Evan Patrick | $350,000 | None Listed On Document | |
| Riethman Shaun | $169,000 | None Available |
Source: Public Records
Mortgage History
| Date | Status | Borrower | Loan Amount |
|---|---|---|---|
| Open | Albers Evan Patrick | $175,000 | |
| Closed | Albers Evan Patrick | $175,000 |
Source: Public Records
Tax History Compared to Growth
Tax History
| Year | Tax Paid | Tax Assessment Tax Assessment Total Assessment is a certain percentage of the fair market value that is determined by local assessors to be the total taxable value of land and additions on the property. | Land | Improvement |
|---|---|---|---|---|
| 2024 | $2,454 | $78,330 | $19,510 | $58,820 |
| 2023 | $2,454 | $78,330 | $19,510 | $58,820 |
| 2022 | $2,226 | $63,830 | $15,740 | $48,090 |
| 2021 | $2,249 | $63,830 | $15,740 | $48,090 |
| 2020 | $2,249 | $63,830 | $15,740 | $48,090 |
| 2019 | $1,823 | $52,370 | $12,670 | $39,700 |
| 2018 | $1,783 | $52,370 | $12,670 | $39,700 |
| 2017 | $1,792 | $52,340 | $12,670 | $39,670 |
| 2016 | $1,576 | $46,700 | $10,130 | $36,570 |
| 2015 | $1,432 | $45,910 | $10,130 | $35,780 |
| 2014 | $1,432 | $45,910 | $10,130 | $35,780 |
| 2013 | $1,240 | $37,740 | $10,130 | $27,610 |
Source: Public Records
Map
Nearby Homes