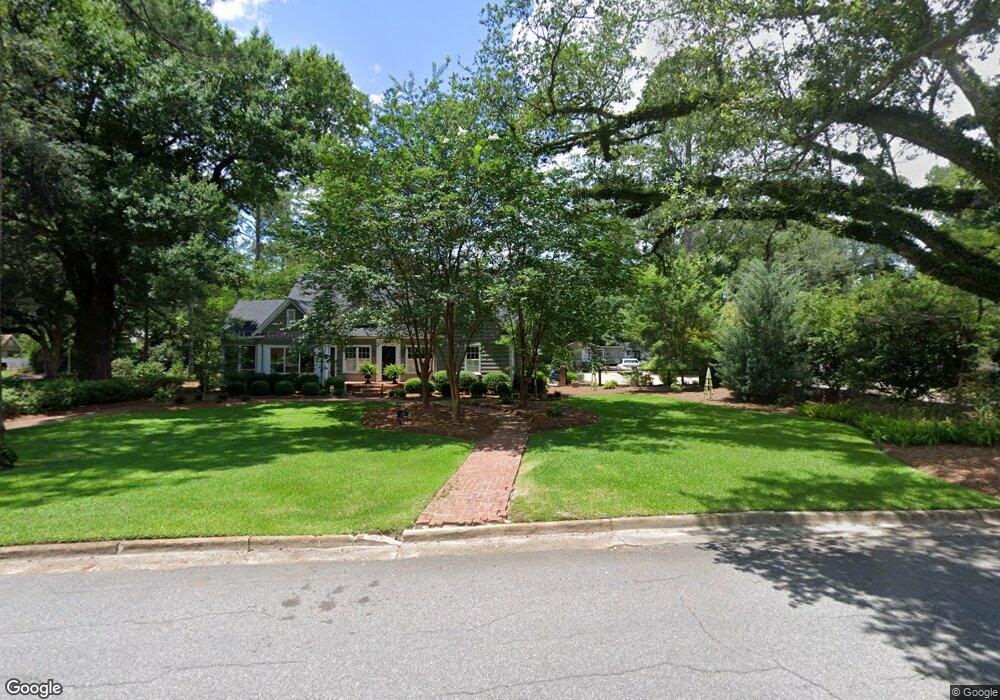
709 6th Ave Albany, GA 31701
Rawson Park NeighborhoodEstimated Value: $120,000 - $173,000
4
Beds
4
Baths
1,558
Sq Ft
$90/Sq Ft
Est. Value
About This Home
This home is located at 709 6th Ave, Albany, GA 31701 and is currently estimated at $140,000, approximately $89 per square foot. 709 6th Ave is a home located in Dougherty County with nearby schools including Northside Elementary School, Albany Middle School, and Albany High School.
Ownership History
Date
Name
Owned For
Owner Type
Purchase Details
Closed on
Aug 9, 2023
Sold by
Swj Properties Llc
Bought by
Myler Properties Llc
Current Estimated Value
Purchase Details
Closed on
Dec 19, 2022
Sold by
Vandalay Holdings Llc
Bought by
Jnd Properties Llc
Purchase Details
Closed on
Jul 10, 2020
Sold by
Thomas & Thomas Holdings Llc
Bought by
Vandalay Holdings Llc
Purchase Details
Closed on
Mar 5, 2004
Sold by
Parr Donny Thomas and Fountain Patricia C
Bought by
Thomas & Thomas Holdings Llc
Purchase Details
Closed on
Oct 14, 2003
Sold by
Parr Donny Thomas Trustee
Bought by
Parr Donny Thomas and Fountain Patric
Purchase Details
Closed on
Jun 16, 2003
Sold by
Parr Solomon T By Exec Lw&T
Bought by
Parr Donny Thomas
Purchase Details
Closed on
Dec 30, 1979
Sold by
Parr Donald Thomas
Bought by
Parr Solomon T
Create a Home Valuation Report for This Property
The Home Valuation Report is an in-depth analysis detailing your home's value as well as a comparison with similar homes in the area
Home Values in the Area
Average Home Value in this Area
Purchase History
| Date | Buyer | Sale Price | Title Company |
|---|---|---|---|
| Myler Properties Llc | $150,000 | -- | |
| Myler Properties Llc | $150,000 | -- | |
| Jnd Properties Llc | $240,000 | -- | |
| Vandalay Holdings Llc | $70,000 | -- | |
| Thomas & Thomas Holdings Llc | -- | -- | |
| Parr Donny Thomas | -- | -- | |
| Parr Donny Thomas | -- | -- | |
| Parr Solomon T | -- | -- |
Source: Public Records
Tax History Compared to Growth
Tax History
| Year | Tax Paid | Tax Assessment Tax Assessment Total Assessment is a certain percentage of the fair market value that is determined by local assessors to be the total taxable value of land and additions on the property. | Land | Improvement |
|---|---|---|---|---|
| 2024 | $1,321 | $27,680 | $7,240 | $20,440 |
| 2023 | $1,290 | $27,680 | $7,240 | $20,440 |
| 2022 | $1,294 | $27,680 | $7,240 | $20,440 |
| 2021 | $957 | $27,680 | $7,240 | $20,440 |
| 2020 | $1,203 | $27,680 | $7,240 | $20,440 |
| 2019 | $1,207 | $27,680 | $7,240 | $20,440 |
| 2018 | $1,213 | $27,680 | $7,240 | $20,440 |
| 2017 | $1,130 | $27,680 | $7,240 | $20,440 |
| 2016 | $1,130 | $27,680 | $7,240 | $20,440 |
| 2015 | $1,133 | $27,680 | $7,240 | $20,440 |
| 2014 | $1,174 | $29,040 | $8,600 | $20,440 |
Source: Public Records
Map
Nearby Homes