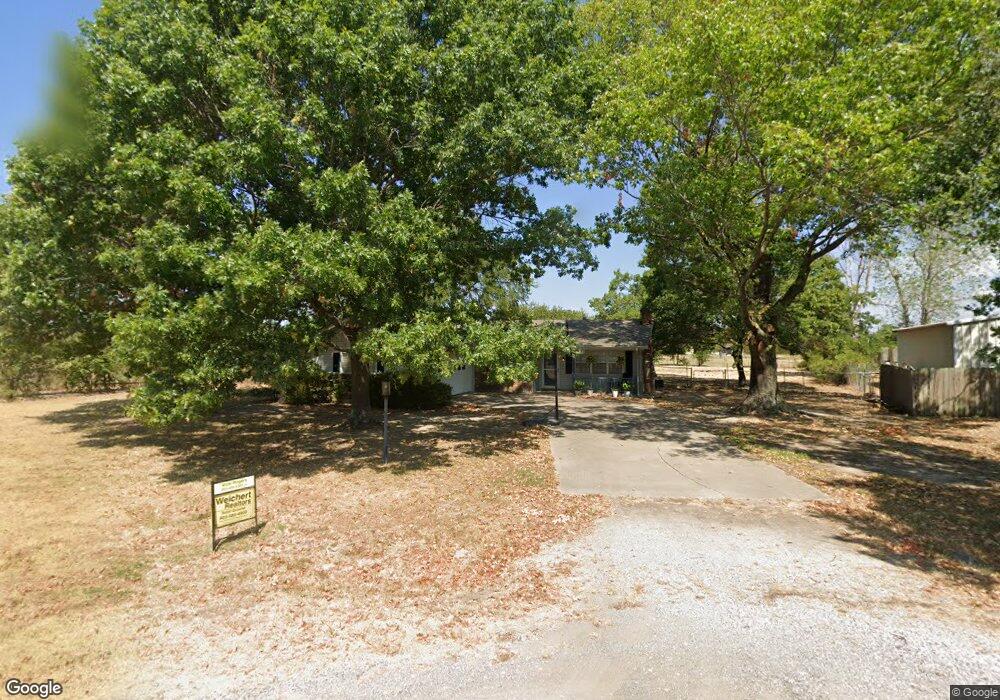
709 Amy Way Bonham, TX 75418
Estimated Value: $186,000 - $279,000
3
Beds
2
Baths
1,148
Sq Ft
$194/Sq Ft
Est. Value
About This Home
This home is located at 709 Amy Way, Bonham, TX 75418 and is currently estimated at $223,116, approximately $194 per square foot. 709 Amy Way is a home located in Fannin County with nearby schools including Finley-Oates Elementary School and LH Rather Jr High School.
Ownership History
Date
Name
Owned For
Owner Type
Purchase Details
Closed on
Apr 11, 2016
Sold by
Boatright Joseph Neilson
Bought by
Horton David K and Horton Lisa A
Current Estimated Value
Home Financials for this Owner
Home Financials are based on the most recent Mortgage that was taken out on this home.
Original Mortgage
$36,000
Outstanding Balance
$22,585
Interest Rate
4.37%
Mortgage Type
Adjustable Rate Mortgage/ARM
Estimated Equity
$200,531
Purchase Details
Closed on
Sep 30, 2008
Sold by
Boatright Joe N and Boatright Tracy L
Bought by
Biggers Martha U
Create a Home Valuation Report for This Property
The Home Valuation Report is an in-depth analysis detailing your home's value as well as a comparison with similar homes in the area
Home Values in the Area
Average Home Value in this Area
Purchase History
| Date | Buyer | Sale Price | Title Company |
|---|---|---|---|
| Horton David K | -- | None Available | |
| Biggers Martha U | -- | None Available |
Source: Public Records
Mortgage History
| Date | Status | Borrower | Loan Amount |
|---|---|---|---|
| Open | Horton David K | $36,000 |
Source: Public Records
Tax History Compared to Growth
Tax History
| Year | Tax Paid | Tax Assessment Tax Assessment Total Assessment is a certain percentage of the fair market value that is determined by local assessors to be the total taxable value of land and additions on the property. | Land | Improvement |
|---|---|---|---|---|
| 2025 | $2,669 | $191,450 | $30,260 | $161,190 |
| 2024 | $2,669 | $192,040 | $30,260 | $161,780 |
| 2023 | $2,330 | $165,000 | $29,580 | $135,420 |
| 2022 | $2,311 | $141,640 | $23,170 | $118,470 |
| 2021 | $1,868 | $99,760 | $10,830 | $88,930 |
| 2020 | $1,739 | $91,480 | $7,930 | $83,550 |
| 2019 | $1,678 | $85,130 | $6,860 | $78,270 |
| 2018 | $1,496 | $76,030 | $6,860 | $69,170 |
| 2017 | $1,425 | $75,550 | $6,860 | $68,690 |
| 2016 | $1,355 | $71,860 | $6,860 | $65,000 |
| 2015 | -- | $69,140 | $6,860 | $62,280 |
| 2014 | -- | $72,030 | $6,930 | $65,100 |
Source: Public Records
Map
Nearby Homes