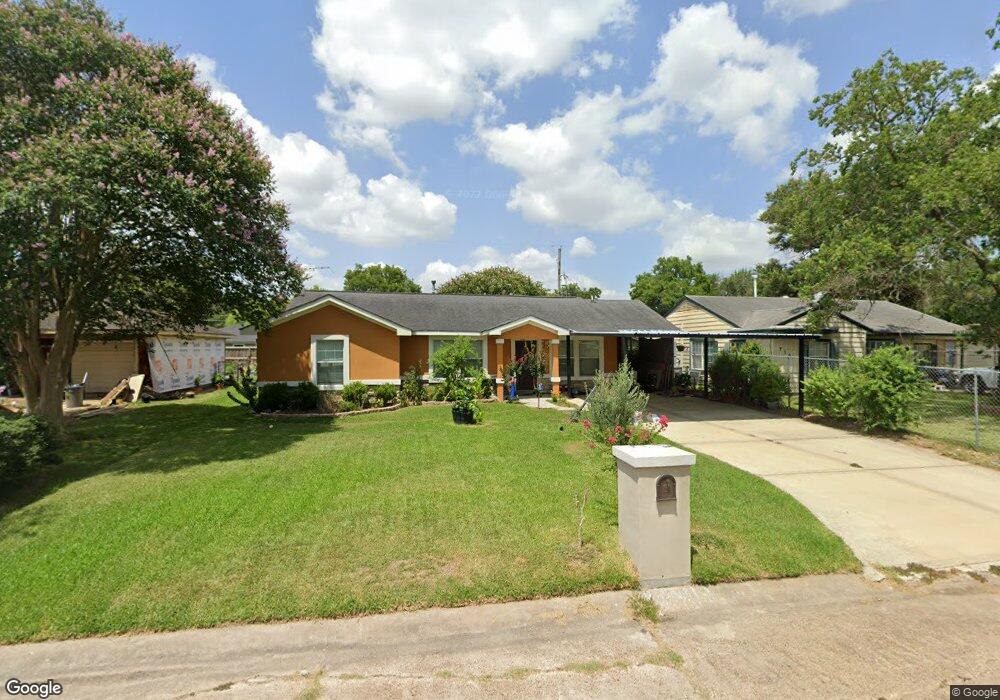
709 Banton St Channelview, TX 77530
Estimated Value: $159,000 - $188,000
3
Beds
1
Bath
1,246
Sq Ft
$140/Sq Ft
Est. Value
About This Home
This home is located at 709 Banton St, Channelview, TX 77530 and is currently estimated at $174,907, approximately $140 per square foot. 709 Banton St is a home located in Harris County with nearby schools including Channelview High School and Family Christian Academy.
Ownership History
Date
Name
Owned For
Owner Type
Purchase Details
Closed on
Mar 31, 2005
Sold by
Penas Jose N and Penas Pureza J
Bought by
Calzada Juan L and Calzada Susie
Current Estimated Value
Home Financials for this Owner
Home Financials are based on the most recent Mortgage that was taken out on this home.
Original Mortgage
$49,445
Outstanding Balance
$25,466
Interest Rate
5.75%
Mortgage Type
Purchase Money Mortgage
Estimated Equity
$149,441
Purchase Details
Closed on
Feb 7, 2001
Sold by
Robichaux Rick
Bought by
Penas Jose N and Penas Pureza J
Home Financials for this Owner
Home Financials are based on the most recent Mortgage that was taken out on this home.
Original Mortgage
$46,606
Interest Rate
7.13%
Mortgage Type
FHA
Purchase Details
Closed on
Dec 14, 1999
Sold by
Hinton Joe D
Bought by
Robichaux Rick
Home Financials for this Owner
Home Financials are based on the most recent Mortgage that was taken out on this home.
Original Mortgage
$24,831
Interest Rate
7.71%
Mortgage Type
Seller Take Back
Create a Home Valuation Report for This Property
The Home Valuation Report is an in-depth analysis detailing your home's value as well as a comparison with similar homes in the area
Home Values in the Area
Average Home Value in this Area
Purchase History
| Date | Buyer | Sale Price | Title Company |
|---|---|---|---|
| Calzada Juan L | -- | First American Title | |
| Penas Jose N | -- | American Title Co | |
| Robichaux Rick | -- | -- |
Source: Public Records
Mortgage History
| Date | Status | Borrower | Loan Amount |
|---|---|---|---|
| Open | Calzada Juan L | $49,445 | |
| Previous Owner | Penas Jose N | $46,606 | |
| Previous Owner | Robichaux Rick | $24,831 |
Source: Public Records
Tax History Compared to Growth
Tax History
| Year | Tax Paid | Tax Assessment Tax Assessment Total Assessment is a certain percentage of the fair market value that is determined by local assessors to be the total taxable value of land and additions on the property. | Land | Improvement |
|---|---|---|---|---|
| 2025 | $1,415 | $144,760 | $34,256 | $110,504 |
| 2024 | $1,415 | $142,797 | $34,256 | $108,541 |
| 2023 | $1,415 | $152,322 | $34,256 | $118,066 |
| 2022 | $2,485 | $133,089 | $34,256 | $98,833 |
| 2021 | $2,351 | $106,325 | $34,256 | $72,069 |
| 2020 | $2,266 | $94,425 | $31,251 | $63,174 |
| 2019 | $2,107 | $94,425 | $31,251 | $63,174 |
| 2018 | $669 | $78,031 | $24,039 | $53,992 |
| 2017 | $1,743 | $78,031 | $24,039 | $53,992 |
| 2016 | $1,584 | $71,757 | $18,029 | $53,728 |
| 2015 | $1,047 | $58,015 | $11,419 | $46,596 |
| 2014 | $1,047 | $49,803 | $11,419 | $38,384 |
Source: Public Records
Map
Nearby Homes
- 822 Woodhue St
- 818 Mccardell St
- 702 Norell St
- 714 Horncastle St
- 15603 N Brentwood St
- 15506 Vonnett St
- 523 Sheldon Rd
- 815 Spates St
- 16023 Ridlon St
- 16032 1/2 Ridlon St
- 814 Kilpatrick St
- 15418 Lost Lariat Ct
- 15418 Cielo Azul Ln
- 743 Knob Hollow St
- 803 Knob Hollow St
- 431 Crockett St
- 722 Dell Dale St
- 1230 Baja Vista Way
- 1109 Becker St
- 910 Calm Creek Ct