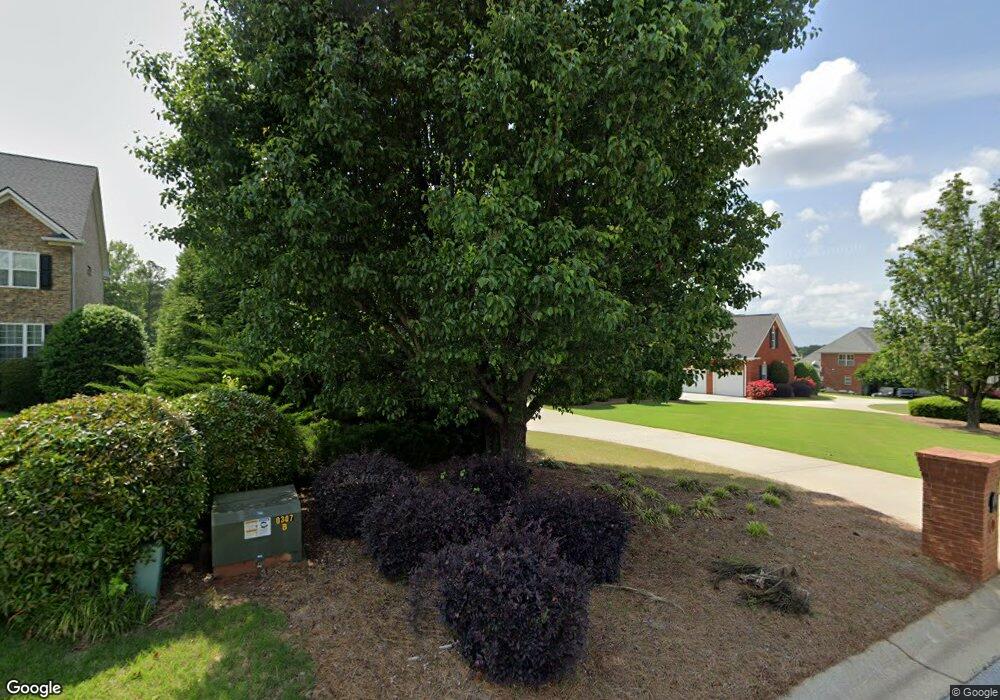
709 Birkdale Blvd Carrollton, GA 30116
Estimated Value: $771,000 - $864,000
5
Beds
5
Baths
5,158
Sq Ft
$158/Sq Ft
Est. Value
About This Home
This home is located at 709 Birkdale Blvd, Carrollton, GA 30116 and is currently estimated at $815,282, approximately $158 per square foot. 709 Birkdale Blvd is a home located in Carroll County with nearby schools including Carrollton Elementary School, Carrollton Upper Elementary School, and Carrollton Middle School.
Ownership History
Date
Name
Owned For
Owner Type
Purchase Details
Closed on
Jul 21, 2020
Sold by
Charron Kevin Ann
Bought by
Charron Kevin M and Charron Kimberly A
Current Estimated Value
Home Financials for this Owner
Home Financials are based on the most recent Mortgage that was taken out on this home.
Original Mortgage
$408,000
Outstanding Balance
$282,199
Interest Rate
3.1%
Mortgage Type
New Conventional
Estimated Equity
$533,083
Purchase Details
Closed on
Oct 15, 2007
Sold by
Perry Carl E
Bought by
Charron Kevin
Home Financials for this Owner
Home Financials are based on the most recent Mortgage that was taken out on this home.
Original Mortgage
$357,600
Interest Rate
6.26%
Mortgage Type
New Conventional
Purchase Details
Closed on
Jul 30, 2002
Sold by
Denco Homes Llc
Bought by
Perry Carl E and Perry Lynda A
Purchase Details
Closed on
Jul 25, 2001
Sold by
Oak Mountain Champio
Bought by
Denco Homes Llc
Purchase Details
Closed on
Aug 20, 1998
Bought by
Oak Mountain Champio
Create a Home Valuation Report for This Property
The Home Valuation Report is an in-depth analysis detailing your home's value as well as a comparison with similar homes in the area
Home Values in the Area
Average Home Value in this Area
Purchase History
| Date | Buyer | Sale Price | Title Company |
|---|---|---|---|
| Charron Kevin M | -- | -- | |
| Charron Kevin | $447,000 | -- | |
| Perry Carl E | $337,000 | -- | |
| Denco Homes Llc | $268,600 | -- | |
| Oak Mountain Champio | -- | -- |
Source: Public Records
Mortgage History
| Date | Status | Borrower | Loan Amount |
|---|---|---|---|
| Open | Charron Kevin M | $408,000 | |
| Previous Owner | Charron Kevin | $357,600 |
Source: Public Records
Tax History Compared to Growth
Tax History
| Year | Tax Paid | Tax Assessment Tax Assessment Total Assessment is a certain percentage of the fair market value that is determined by local assessors to be the total taxable value of land and additions on the property. | Land | Improvement |
|---|---|---|---|---|
| 2024 | $7,682 | $316,689 | $26,000 | $290,689 |
| 2023 | $7,682 | $291,560 | $26,000 | $265,560 |
| 2022 | $6,354 | $239,305 | $26,000 | $213,305 |
| 2021 | $6,119 | $229,049 | $26,000 | $203,049 |
| 2020 | $5,579 | $205,397 | $28,000 | $177,397 |
| 2019 | $4,859 | $175,778 | $28,000 | $147,778 |
| 2018 | $4,507 | $157,973 | $28,000 | $129,973 |
| 2017 | $4,530 | $157,973 | $28,000 | $129,973 |
| 2016 | $4,555 | $157,973 | $28,000 | $129,973 |
| 2015 | $4,303 | $143,314 | $20,000 | $123,314 |
| 2014 | $4,322 | $143,314 | $20,000 | $123,314 |
Source: Public Records
Map
Nearby Homes
- 707 Birkdale Blvd
- 711 Birkdale Blvd
- 705 Birkdale Blvd
- 713 Birkdale Blvd
- 710 Birkdale Blvd
- 708 Birkdale Blvd
- 703 Birkdale Blvd
- 706 Birkdale Blvd
- 715 Birkdale Blvd
- 100 Sussex Ct
- 717 Birkdale Blvd
- 717 Birkdale Blvd
- 700 Birkdale Blvd
- 102 Sussex Ct
- 719 Birkdale Blvd
- 117 Pinehurst Way
- 718 Birkdale Blvd
- 119 Pinehurst Way
- 115 Pinehurst Way
- 801 Birkdale Blvd