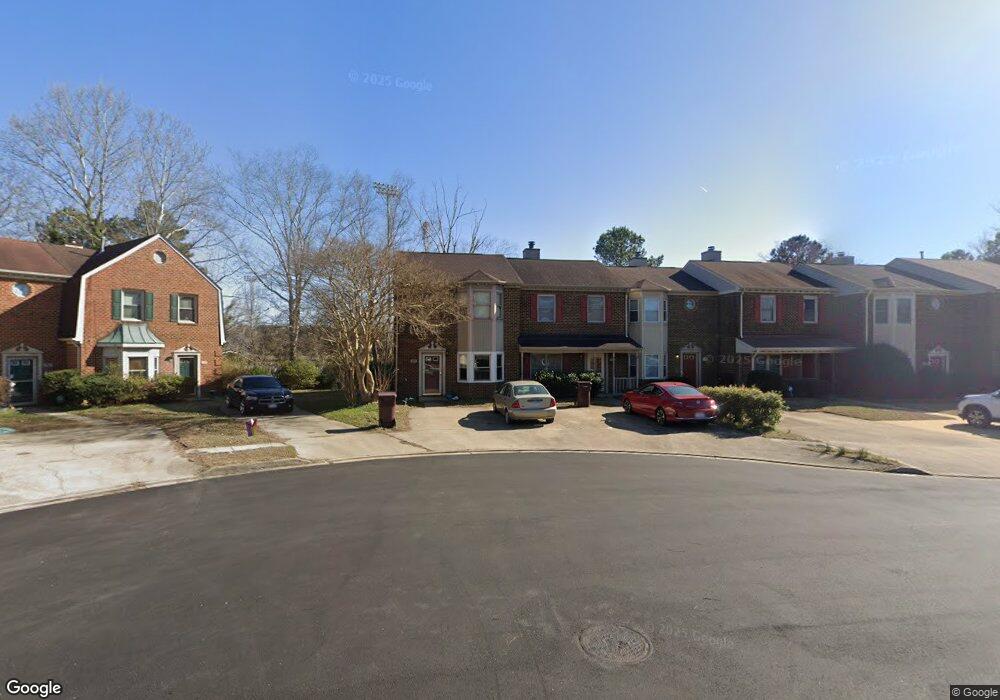
709 Creekside Crescent Chesapeake, VA 23320
Greenbrier West NeighborhoodEstimated Value: $260,000 - $283,000
3
Beds
3
Baths
1,400
Sq Ft
$193/Sq Ft
Est. Value
About This Home
This home is located at 709 Creekside Crescent, Chesapeake, VA 23320 and is currently estimated at $269,805, approximately $192 per square foot. 709 Creekside Crescent is a home located in Chesapeake City with nearby schools including B.M. Williams Primary School, Crestwood Intermediate School, and Crestwood Middle School.
Ownership History
Date
Name
Owned For
Owner Type
Purchase Details
Closed on
Dec 19, 2008
Sold by
Citimortgage Inc
Bought by
Ibrahim Mostafa M
Current Estimated Value
Home Financials for this Owner
Home Financials are based on the most recent Mortgage that was taken out on this home.
Original Mortgage
$130,240
Outstanding Balance
$85,845
Interest Rate
6.08%
Mortgage Type
FHA
Estimated Equity
$183,960
Purchase Details
Closed on
Jun 4, 2008
Sold by
Waddler Walter D
Bought by
Citimortgage Inc
Purchase Details
Closed on
Mar 7, 2000
Sold by
Hecker Andrew C
Bought by
Waddler Walter D
Home Financials for this Owner
Home Financials are based on the most recent Mortgage that was taken out on this home.
Original Mortgage
$90,780
Interest Rate
8.18%
Create a Home Valuation Report for This Property
The Home Valuation Report is an in-depth analysis detailing your home's value as well as a comparison with similar homes in the area
Home Values in the Area
Average Home Value in this Area
Purchase History
| Date | Buyer | Sale Price | Title Company |
|---|---|---|---|
| Ibrahim Mostafa M | $160,000 | -- | |
| Citimortgage Inc | $187,118 | -- | |
| Waddler Walter D | $89,000 | -- |
Source: Public Records
Mortgage History
| Date | Status | Borrower | Loan Amount |
|---|---|---|---|
| Open | Ibrahim Mostafa M | $130,240 | |
| Previous Owner | Waddler Walter D | $90,780 |
Source: Public Records
Tax History Compared to Growth
Tax History
| Year | Tax Paid | Tax Assessment Tax Assessment Total Assessment is a certain percentage of the fair market value that is determined by local assessors to be the total taxable value of land and additions on the property. | Land | Improvement |
|---|---|---|---|---|
| 2025 | $2,649 | $268,300 | $105,000 | $163,300 |
| 2024 | $2,649 | $262,300 | $100,000 | $162,300 |
| 2023 | $2,137 | $236,900 | $90,000 | $146,900 |
| 2022 | $2,110 | $208,900 | $80,000 | $128,900 |
| 2021 | $1,934 | $184,200 | $65,000 | $119,200 |
| 2020 | $1,889 | $179,900 | $60,000 | $119,900 |
| 2019 | $1,840 | $175,200 | $60,000 | $115,200 |
| 2018 | $1,840 | $161,600 | $60,000 | $101,600 |
| 2017 | $1,825 | $173,800 | $65,000 | $108,800 |
| 2016 | $1,698 | $161,700 | $55,000 | $106,700 |
| 2015 | $1,698 | $161,700 | $55,000 | $106,700 |
| 2014 | $1,644 | $156,600 | $55,000 | $101,600 |
Source: Public Records
Map
Nearby Homes
- 106 Fireweed Ct
- 208 Fireweed Ct
- 1918 Willow Point Arch
- 714 Willow Green Ct
- 1818 Willow Point Arch
- 838 Creekside Crescent
- 2410 Willow Point Arch
- 707 Sailfish Quay
- 605 Sail Fish Quay
- 603 Sail Fish Quay
- 412 Preservation Loop
- 559 Seahorse Run
- 424 Supplejack Ct
- 407 Preservation Reach
- 401 Preservation Reach
- 367 Conservation Crossing
- 335 Preservation Reach
- 447 Seahorse Run
- 752 Great Bridge Blvd
- 700 Rapidan River Ct Unit D
- 711 Creekside Crescent
- 713 Creekside Crescent
- 707 Creekside Crescent
- 705 Creekside Crescent
- 715 Creekside Crescent
- 717 Creekside Crescent
- 703 Creekside Crescent
- 701 Creekside Crescent
- 701 Creekside Crescent Unit 701
- 719 Creekside Crescent
- 723 Creekside Crescent
- 639 Creekside Ct
- 641 Creekside Ct
- 727 Creekside Crescent
- 729 Creekside Crescent
- 637 Creekside Ct
- 635 Creekside Ct
- 731 Creekside Crescent
- 633 Creekside Ct
- 733 Creekside Crescent