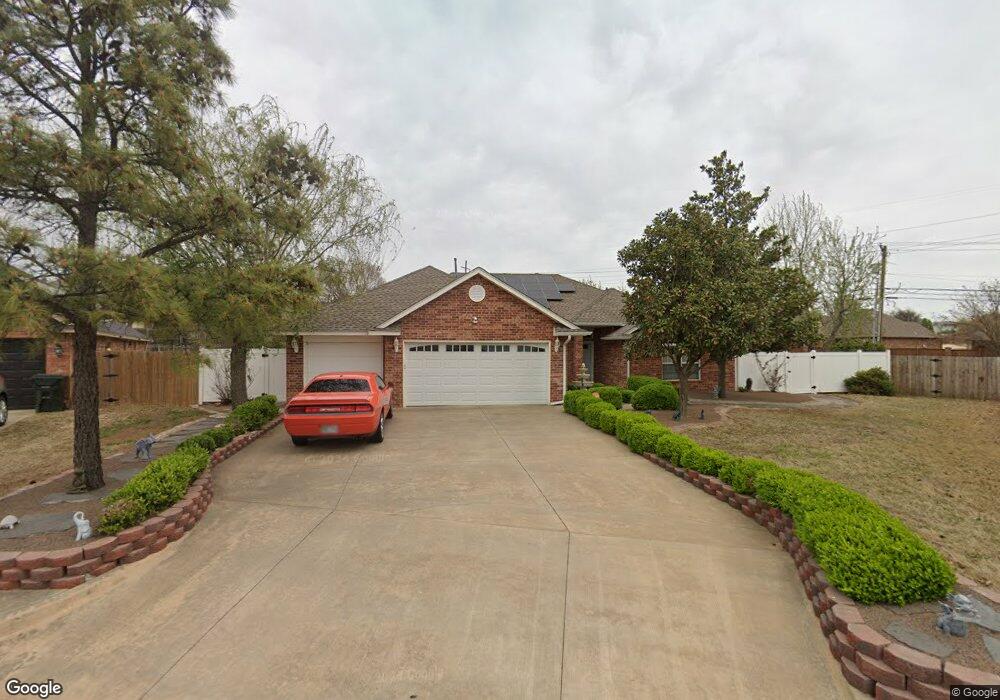
709 Crescent Cir Oklahoma City, OK 73110
Estimated Value: $297,000 - $304,000
3
Beds
2
Baths
2,189
Sq Ft
$137/Sq Ft
Est. Value
About This Home
This home is located at 709 Crescent Cir, Oklahoma City, OK 73110 and is currently estimated at $300,417, approximately $137 per square foot. 709 Crescent Cir is a home located in Oklahoma County with nearby schools including Cleveland Bailey Elementary School, Midwest City Middle School, and Midwest City High School.
Ownership History
Date
Name
Owned For
Owner Type
Purchase Details
Closed on
Jun 23, 2010
Sold by
Deurchison Silvia Aranda
Bought by
Urchison Kenneth L
Current Estimated Value
Purchase Details
Closed on
Sep 27, 2004
Sold by
Cotney Delbert and Cotney Paula
Bought by
Urchison Kenneth L
Home Financials for this Owner
Home Financials are based on the most recent Mortgage that was taken out on this home.
Original Mortgage
$163,563
Outstanding Balance
$81,222
Interest Rate
5.81%
Mortgage Type
Purchase Money Mortgage
Estimated Equity
$219,195
Purchase Details
Closed on
Mar 2, 2004
Sold by
Mason Ann S
Bought by
Cotney Delbert
Home Financials for this Owner
Home Financials are based on the most recent Mortgage that was taken out on this home.
Original Mortgage
$160,000
Interest Rate
5.67%
Mortgage Type
Construction
Create a Home Valuation Report for This Property
The Home Valuation Report is an in-depth analysis detailing your home's value as well as a comparison with similar homes in the area
Home Values in the Area
Average Home Value in this Area
Purchase History
| Date | Buyer | Sale Price | Title Company |
|---|---|---|---|
| Urchison Kenneth L | -- | Stewart Escrow & Title | |
| Urchison Kenneth L | $204,500 | American Guaranty Title Co | |
| Cotney Delbert | $25,000 | -- |
Source: Public Records
Mortgage History
| Date | Status | Borrower | Loan Amount |
|---|---|---|---|
| Open | Urchison Kenneth L | $163,563 | |
| Previous Owner | Cotney Delbert | $160,000 |
Source: Public Records
Tax History Compared to Growth
Tax History
| Year | Tax Paid | Tax Assessment Tax Assessment Total Assessment is a certain percentage of the fair market value that is determined by local assessors to be the total taxable value of land and additions on the property. | Land | Improvement |
|---|---|---|---|---|
| 2024 | $3,305 | $29,481 | $6,374 | $23,107 |
| 2023 | $3,305 | $28,078 | $6,791 | $21,287 |
| 2022 | $3,119 | $26,740 | $6,424 | $20,316 |
| 2021 | $3,042 | $25,467 | $6,642 | $18,825 |
| 2020 | $2,978 | $24,255 | $6,699 | $17,556 |
| 2019 | $2,779 | $23,650 | $6,699 | $16,951 |
| 2018 | $2,540 | $23,045 | $0 | $0 |
| 2017 | $2,617 | $23,374 | $5,590 | $17,784 |
| 2016 | $2,645 | $22,989 | $5,590 | $17,399 |
| 2015 | $2,689 | $22,447 | $5,452 | $16,995 |
| 2014 | $2,558 | $21,379 | $4,174 | $17,205 |
Source: Public Records
Map
Nearby Homes
- 3321 N Ridgewood Dr
- 3609 Sunvalley Dr
- 617 W Silver Meadow Dr
- 608 W Silver Meadow Dr
- 3701 Ridgehaven Dr
- 3620 Ridgehaven Dr
- 3605 Mount Pleasant Dr
- 3409 Shadybrook Dr
- 3413 Shadybrook Dr
- 1004 W Idylwild Dr
- 1025 W Idylwild Dr
- 700 Greenwood Dr
- 3501 Rolling Ln
- 315 W Silverwood Dr
- 3016 Shadybrook Dr
- 3505 Woodvale Dr
- 112 W Silver Meadow Dr
- 304 W Campbell Dr
- 3407 Woodvale Dr
- 3312 N Glenoaks Dr
- 705 Crescent Cir
- 713 Crescent Cir
- 801 N Air Depot Blvd
- 701 Crescent Cir
- 717 Crescent Cir
- 704 Crescent Cir
- 763 Glenhaven Villas Ct
- 759 Glenhaven Villas Ct
- 721 Crescent Cir
- 767 Glenhaven Villas Ct
- 755 Glenhaven Villas Ct
- 700 Crescent Cir
- 751 Glenhaven Villas Ct
- 725 Crescent Cir
- 685 Crescent Cir
- 684 Crescent Cir
- 771 Glenhaven Villas Ct
- 728 Crescent Cir
- 729 Crescent Cir
- 681 Crescent Cir