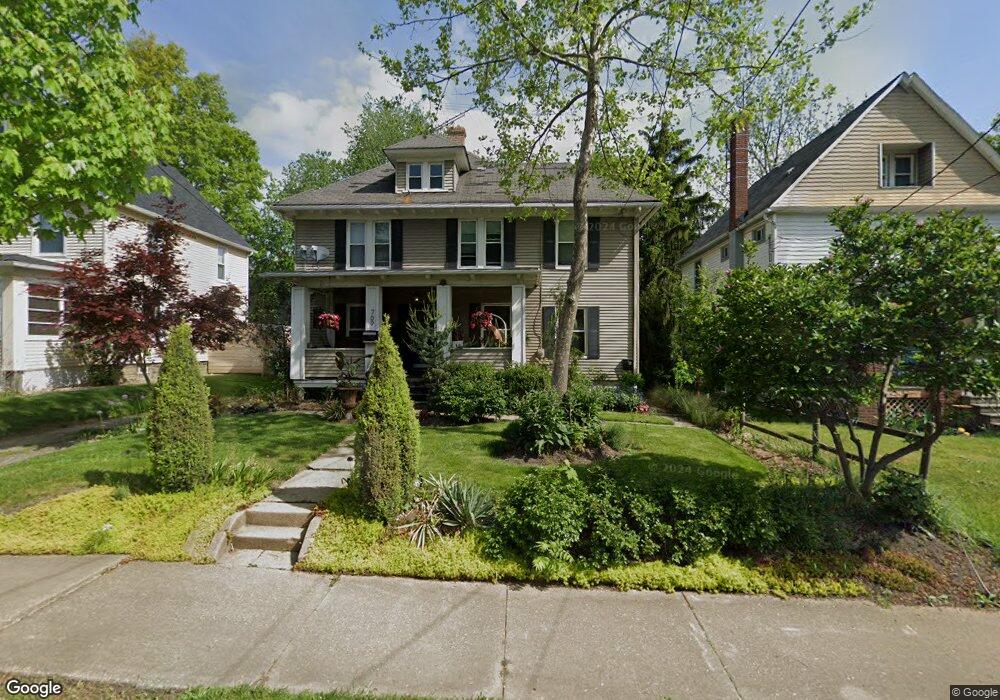
709 Crosby St Akron, OH 44302
Highland Square NeighborhoodEstimated Value: $121,000 - $158,000
4
Beds
2
Baths
2,256
Sq Ft
$61/Sq Ft
Est. Value
About This Home
This home is located at 709 Crosby St, Akron, OH 44302 and is currently estimated at $137,088, approximately $60 per square foot. 709 Crosby St is a home located in Summit County with nearby schools including Towpath Trail High School, St. Vincent Elementary School, and Our Lady Of The Elms Elementary School.
Ownership History
Date
Name
Owned For
Owner Type
Purchase Details
Closed on
Oct 7, 2025
Sold by
Moore Matthew C
Bought by
Moore Ginny L and Moore Matthew C
Current Estimated Value
Purchase Details
Closed on
Mar 7, 2024
Sold by
Davis Michael E
Bought by
Moore Matthew C
Purchase Details
Closed on
Jan 13, 2016
Sold by
Moore Ginny L and Moore Matthew C
Bought by
Moore Matthew C and Davis Michael E
Home Financials for this Owner
Home Financials are based on the most recent Mortgage that was taken out on this home.
Original Mortgage
$57,000
Interest Rate
3.92%
Mortgage Type
New Conventional
Purchase Details
Closed on
Oct 18, 2011
Sold by
Heideman Daniel Lee
Bought by
Moore Ginny L and Moore Matthew C
Purchase Details
Closed on
Feb 21, 2007
Sold by
Heideman Theresa Lynn
Bought by
Heideman Daniel Lee
Purchase Details
Closed on
Aug 4, 2000
Sold by
Neubert Sherrylyn
Bought by
Heideman Daniel L
Home Financials for this Owner
Home Financials are based on the most recent Mortgage that was taken out on this home.
Original Mortgage
$74,715
Interest Rate
10.69%
Create a Home Valuation Report for This Property
The Home Valuation Report is an in-depth analysis detailing your home's value as well as a comparison with similar homes in the area
Home Values in the Area
Average Home Value in this Area
Purchase History
| Date | Buyer | Sale Price | Title Company |
|---|---|---|---|
| Moore Ginny L | -- | None Listed On Document | |
| Moore Matthew C | -- | None Listed On Document | |
| Moore Matthew C | -- | Attorney | |
| Moore Ginny L | $30,000 | Omega Title Agency Llc | |
| Heideman Daniel Lee | -- | Attorney | |
| Heideman Daniel L | $87,900 | Endress/Lawyers Title |
Source: Public Records
Mortgage History
| Date | Status | Borrower | Loan Amount |
|---|---|---|---|
| Previous Owner | Moore Matthew C | $57,000 | |
| Previous Owner | Heideman Daniel L | $74,715 |
Source: Public Records
Tax History Compared to Growth
Tax History
| Year | Tax Paid | Tax Assessment Tax Assessment Total Assessment is a certain percentage of the fair market value that is determined by local assessors to be the total taxable value of land and additions on the property. | Land | Improvement |
|---|---|---|---|---|
| 2025 | $2,143 | $38,693 | $6,801 | $31,892 |
| 2024 | $2,143 | $38,693 | $6,801 | $31,892 |
| 2023 | $2,143 | $38,693 | $6,801 | $31,892 |
| 2022 | $2,238 | $31,844 | $5,576 | $26,268 |
| 2021 | $2,240 | $31,844 | $5,576 | $26,268 |
| 2020 | $2,160 | $31,850 | $5,580 | $26,270 |
| 2019 | $1,932 | $25,760 | $5,580 | $20,180 |
| 2018 | $1,907 | $25,760 | $5,580 | $20,180 |
| 2017 | $1,689 | $25,760 | $5,580 | $20,180 |
| 2016 | $1,690 | $22,300 | $5,580 | $16,720 |
| 2015 | $1,689 | $22,300 | $5,580 | $16,720 |
| 2014 | $1,676 | $22,300 | $5,580 | $16,720 |
| 2013 | $1,642 | $22,300 | $5,580 | $16,720 |
Source: Public Records
Map
Nearby Homes
- 262 S Portage Path
- 120 Beck Ave
- 71 Dodge Ave
- 127 Hollinger Ave
- 141 Grand Ave
- 42 Belvidere Way
- 136 Gale St
- 222 Rhodes Ave
- 359 Beechwood Dr
- 892 Delia Ave
- 939 W Exchange St
- 320 Wildwood Ave
- 893 Delia Ave
- 91 Westwood Ave
- 890 Work Dr
- 525 Crosby St
- 885 Bye St Unit 887
- 900 Work Dr
- 908 Stadelman Ave
- 414 Beechwood Dr
- 713 Crosby St
- 713 Crosby St Unit ID1061099P
- 701 Crosby St
- 151 Byers Ave
- 717 Crosby St
- 106 Westmoreland Terrace
- 126 Westmoreland Terrace
- 145 Byers Ave
- 112 Westmoreland Terrace
- 697 Crosby St
- 122 Westmoreland Terrace
- 107 Westmoreland Terrace
- 125 Westmoreland Terrace
- 695 Crosby St
- 113 115 Westmoreland Terrace
- 135 Byers Ave
- 121 Westmoreland Terrace
- 706 Crosby St
- 113 Westmoreland Terrace Unit 115
- 127 Byers Ave